
Using SCOM To Count Logs and Produce Reports
Recently, I’ve been asked twice to produce daily reports involves counting some kind of logs:
Scenario 1:
The support team need to count number of Application event log entries of events with a specific event ID. A daily report is required to list the number for each computer.
Scenario 2:
An application produces a log file each day. The support team need to count the number of a specific phrase appeared in previous day’s log file. A daily report is required to list the count number for each computer.
The solution I produced for both scenarios are very similar. so I thought I’d blog this one.
- Create a rule in the SCOM management pack to run once a day.
- Write a script within a rule in the SCOM management pack to count the log
- map the count number to performance data and save it in the SCOM operational and data warehouse DB.
- design a report for raw performance data in SQL SRS report builder
- save the report into the management pack
- schedule the report to run and to be emailed out once a day, AFTER the rule has run for the day.
In this blog post, I’m not going to go through the steps of creating the custom data source module and the performance collection rule. They are pretty straightforward and the sample management pack can be downloaded HERE.
I will however go through the steps to create the custom report for the data collected by this rule. I’m creating the report rather than using the built-in performance reports from the “Microsoft Generic Report Library” because none of the built-in performance reports support a table format. I don’t want any fancy charts with the report. All I want is a simple list of the raw perf counter values.
Now, let’s briefly go through the data source module and the performance collection rule.
Data Source Module: contains 2 members: System.Scheduler and Microsoft.Windows.PowerShellPropertyBagTriggerOnlyProbe:
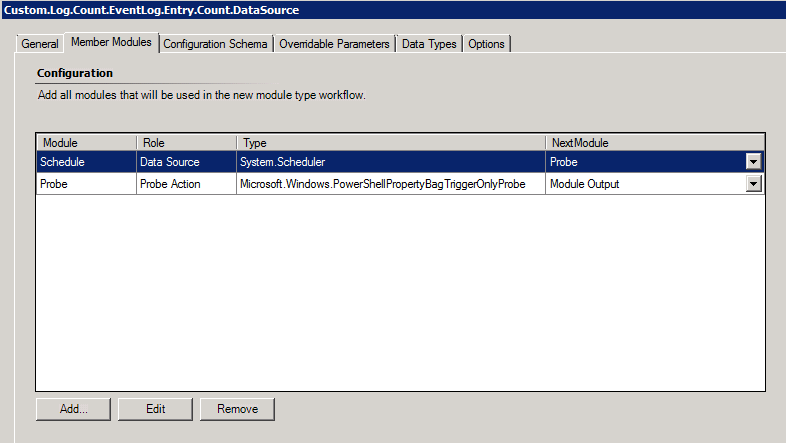
The Microsoft.PowershellPropertyBagTriggerOnlyProbe contains a powershell script that counts event log entries and pass the count into a PropertyBag:
#===========================================================================================
# AUTHOR:  Tao Yang
# DATE:    30/01/2012
# Version: 1.0
# COMMENT: Count for a particular event in event log and pass the count to property bag
#===========================================================================================
Param ([int]$TimeFrameInHours, [string]$LogName, [int]$EventID, [string]$EventSource)

$StartTime = (Get-Date).AddHours(-$TimeFrameInHours)
$iEventCount = 0
Try {
  $Events = Get-EventLog -LogName $LogName -After $StartTime -Source $EventSource | Where-Object {$_.EventID -eq $EventID}
  Foreach ($Event in $Events)
  {
    If ($Event -ne $null) {$iEventCount++}
  }
} Catch {
  $iEventCount = 0
}
$ComputerName = (Get-WmiObject Win32_ComputerSystem).Caption
$oAPI = New-Object -ComObject "MOM.ScriptAPI"
$OAPI.LogScriptEvent("Event-Count.PS1",9999,0,"Start EventID $EventID Perf Collection Rule. Collecting $EventID events since $starttime...")
$oBag = $oAPI.CreatePropertyBag()
$oBag.AddValue('ComputerName', $ComputerName)
$oBag.AddValue('EventCount', $iEventCount)
$oBag.AddValue('TimeFrameInHours', $TimeFrameInHours)
$oBag.AddValue('LogName', $LogName)
$oBag.AddValue('EventID', $EventID)
$oBag.AddValue('EventSource', $EventSource)
$oBag
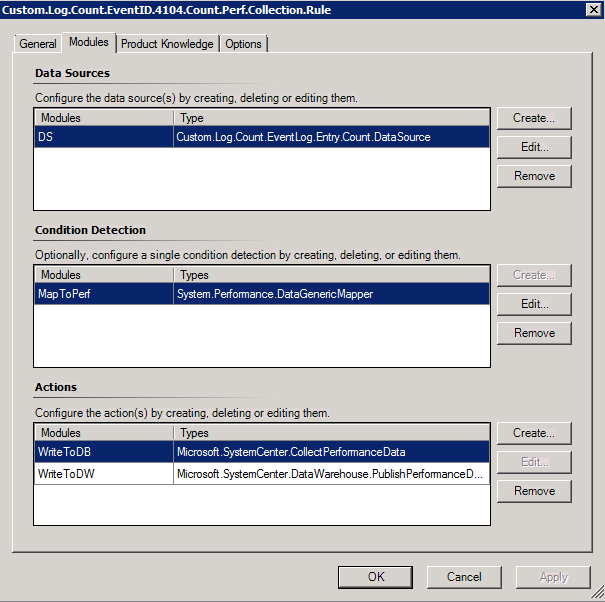
Performance Collection Rule:
This rule contains:
- Data Source: the data source module created previously
- Condition Detection: map the event log count in PropertyBag to performance counter
- Actions: Write performance data to Operational and DW databases.
Report:
Pre-requisites:
- Install the Performance Report Model in SCOM reporting SSRS. Here’s a detailed instruction (even though it was written for SCOM 2007 SP1, it’s also applies to SCOM 2007 R2): http://www.systemcentercentral.com/BlogDetails/tabid/143/IndexID/20269/Default.aspx
- Please Note that in above article, it uses Event model as example. The report I’m going to create uses Performance model. so please make sure Performance.smdl is uploaded into SCOM Reporting SSRS and configured to use the “Data Warehouse Main” data source.
- Import the half finished management pack (with the data source module and the perf collection rule) into a SCOM management group (preferably your development environment).
- Create an override or simply change the schedule of the rule to run ASAP so the perf data is collected. this is very useful when testing the report later on.
Steps of creating the report:
-
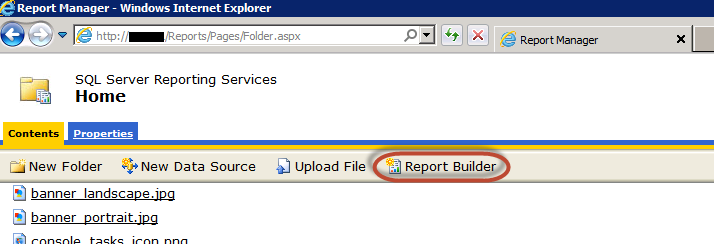
Browse to the SCOM Reporting SSRS reports http://servername/reports URL
-
Launch Report Builder and click “Run” if security warning pops up
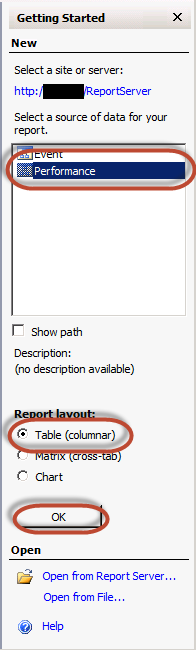
- In Report Builder, choose the following options in “Getting Started” pane to create a new report:
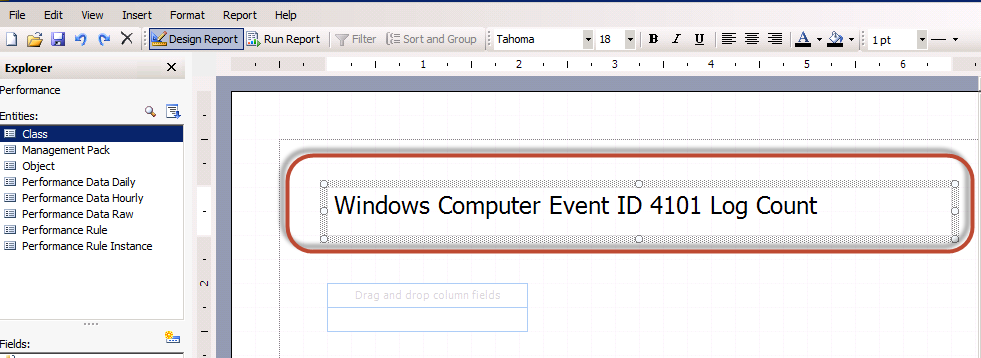
- Enter the report title:
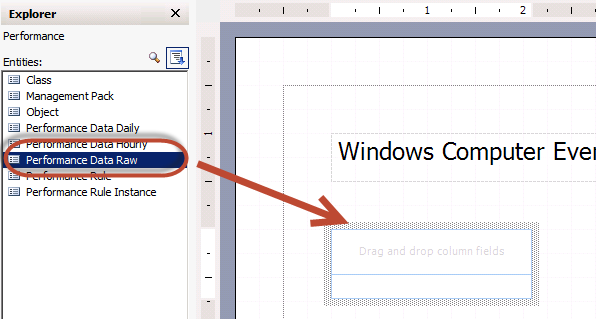
- Drag “Performance Data Raw into the report
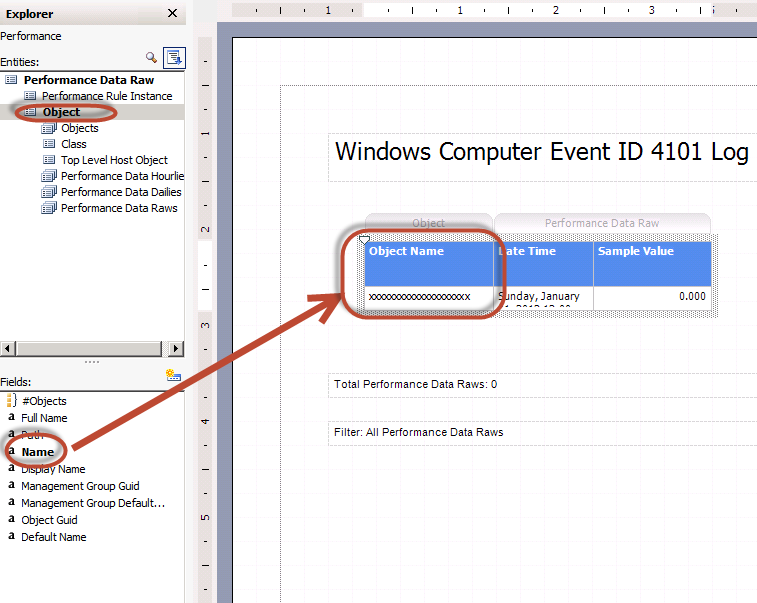
- Under Performance Data Raw / Object, Drag the “Name” field to the report
- Rename the title of each row in the report table:
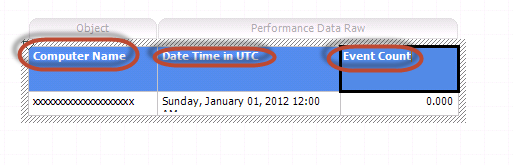
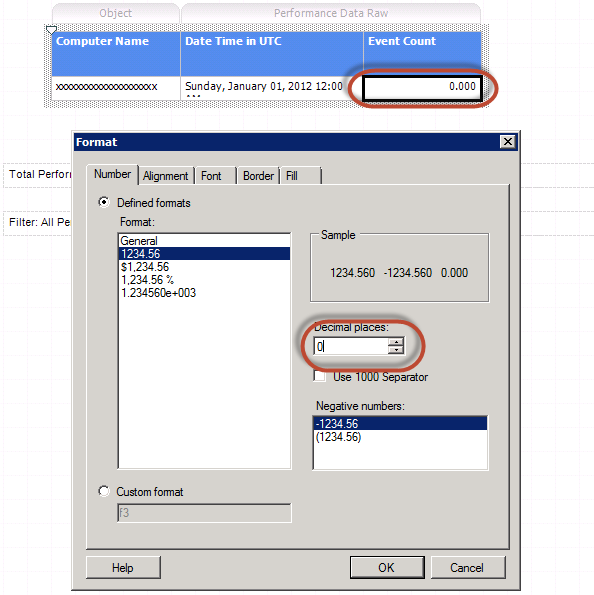
- Right click the number under “Event Count”, select “Format…”, and change “Decimal places” to 0
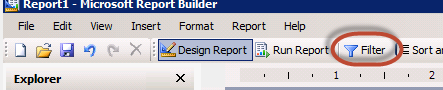
- Click the Filter button to create filters:
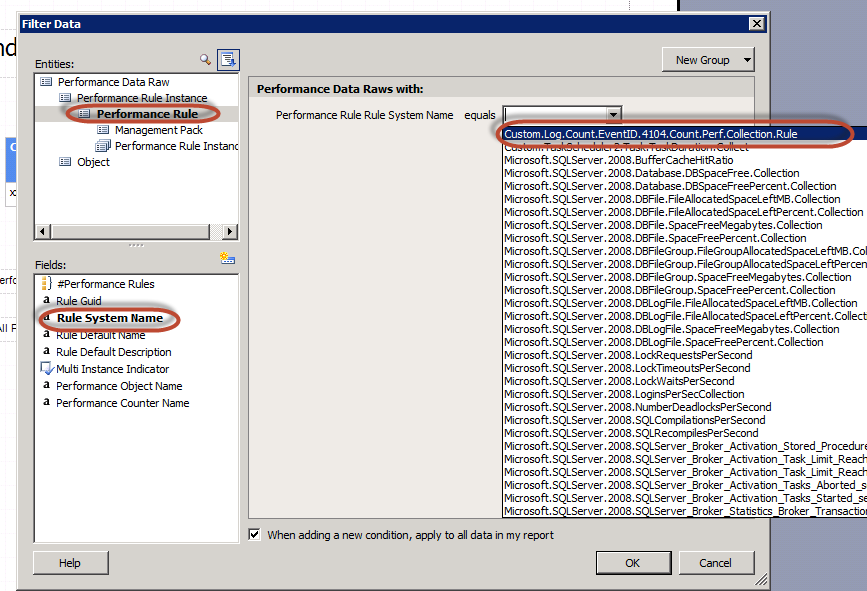
- Under Performance Data Raw \ Performance Rule Instance \ Performance Rule, drag the “Rule System Name” Field to the right and choose the rule I created in the management pack from the list. (Note: the rule name appears on the list because the management pack is already imported into SCOM and this rule has already collected some performance data.)
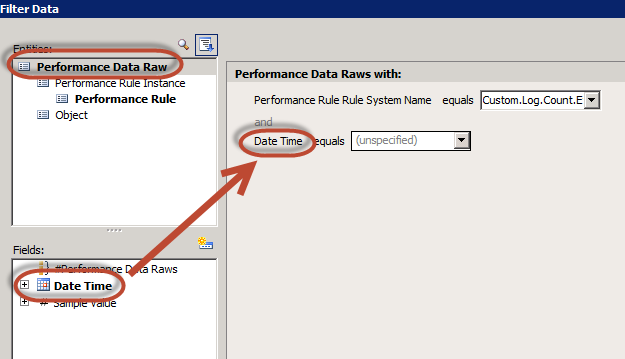
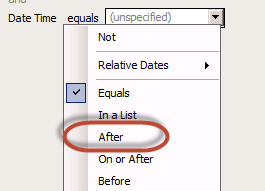
- Click on Performance Data Raw and drag “Date Time” field to the right
- Click on “equals” next to “Date Time” and change it to “After”:
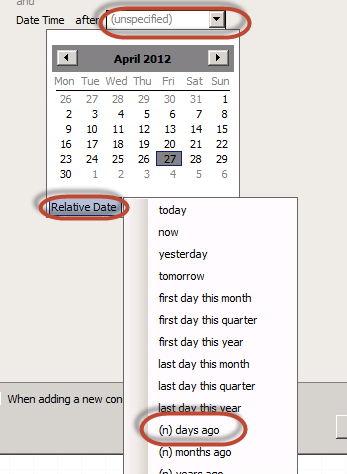
- Choose “(n) days ago”
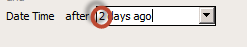
- Change “(n)” to “2”
-
Click OK to exit the Filter Data window
-
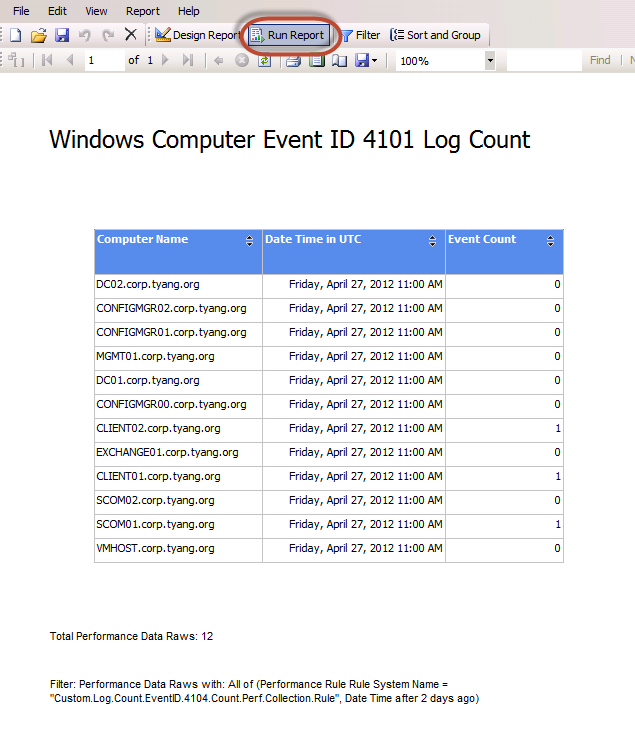
Now, it’s time to test run the report. To do so, use the Run Report button on the top. Here’s the result from my test environment (Note: the date time is in UTC, NOT local time):
- If you want to make the report prettier (i.e. changing the font colour to pink
 ) or adjust the column width, or adding a company logo, you can click on “Design Report” button and modify the report.
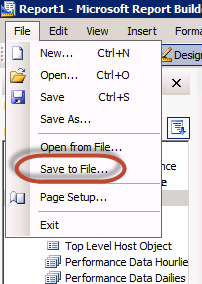
- Once you are happy with the report, save it to a RDL (report definition) file:
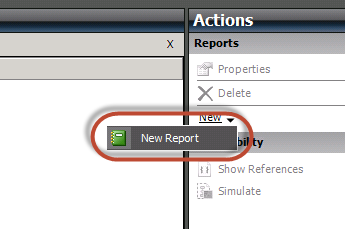
- Open up the half finished management pack (unsealed) in Authoring Console, go to Reporting workspace and create a new report:
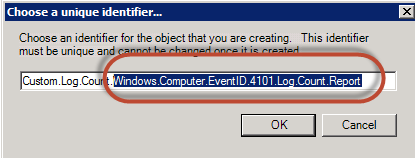
- Give the report an ID:
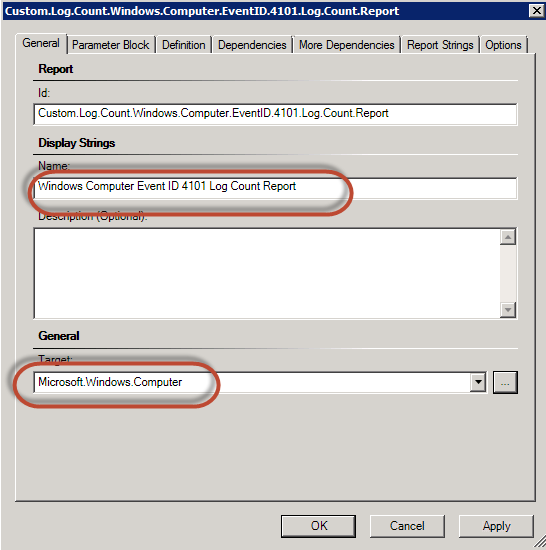
- In the “General” tab, give the report a name and target it to “Microsoft.Windows.Computer” class
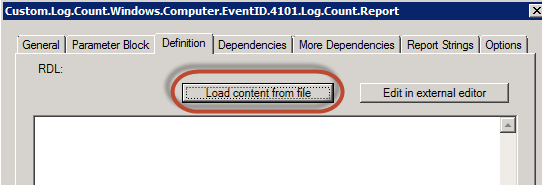
- Go to “Definition” tab, click “Load content from file” and select the RDL file you’ve just created.
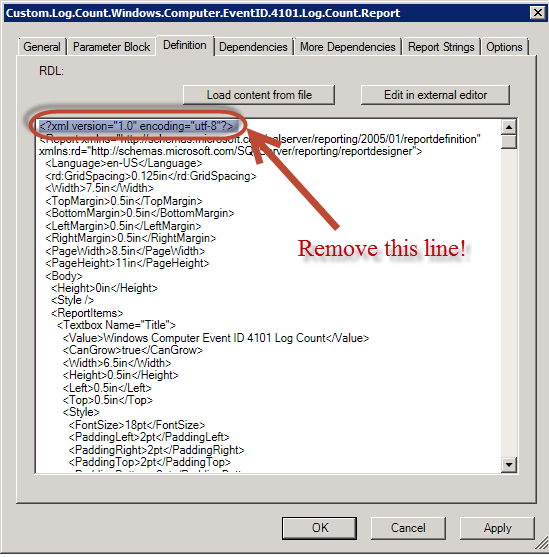
- Once the RDL file is loaded, remove the first line, which is the XML header <?xml version=”1.0” encoding=”utf-8”?>
-
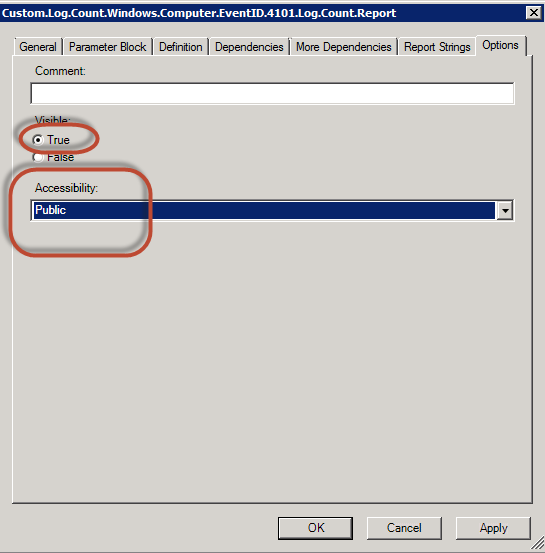
Once the first line is removed, go to “Options” tab
-
Make sure “Visible” is set to “true” and “Accessibility” is set to “public”
-
click apply and OK to exit the window
-
Now that the report is successfully created and tested, if you have changed the schedule of the perf collection rule (either edited the rule directly or created an override), it’s time to change the schedule back.
-
Now, if you want to keep the management pack unsealed, just export the updated management pack with the report into SCOM management group from authoring console. If you want to seal it, do so, and delete the previous unsealed version from the management group first, then import the sealed version into the management group.
I always increase the version number so I can lookup Event ID 1201 in SCOM agent’s Operations Manager log and make sure the updated version of the MP is received:

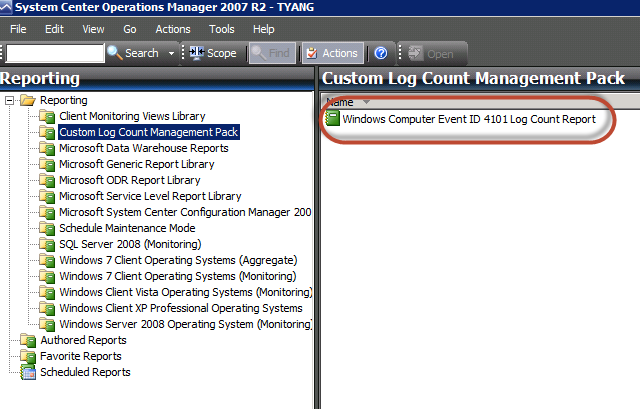
- After couple of minutes, if everything goes well, you should be able to see the report in both Operations Console Reporting workspace and also in SCOM Reporting SSRS site:
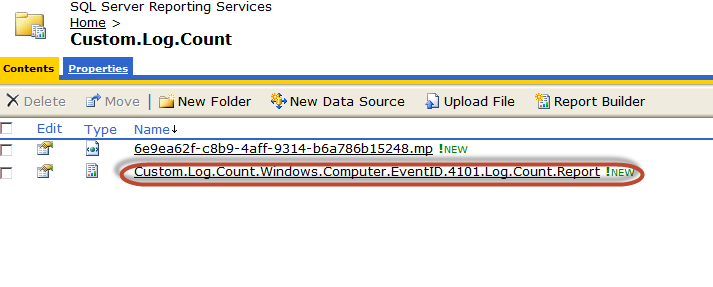
Note: In SSRS, you should also see a .mp file in the same folder. I’ve experienced issues where the report does not get updated with the updated MP, which was caused by incorrect .mp file in SSRS directory. Please refer to my previous post for details.
- Schedule the report in SCOM reporting (so it can be emailed out according to a schedule) if you want to. make sure the report schedule is AFTER the rule schedule time (i.e. if the rule runs daily at 0:00am, the report schedule should be something like daily at 0:30am) otherwise newly collected data is not included in the report.
That concludes the steps to create the report. Few other things I’d also like to mention:
- In my case, for the second scenario I mentioned in the beginning (reading log files), the whole process and idea is the same. The only thing different is the script in the Data Source module.
- I could have moved the condition detection module (System.Performance.DataGenericMapper) from the rule to the data source module. I didn’t do it because then I can use the same data source module for other purposes later. For example, if later on, the support team comes to me and ask me to generate alerts once the count reaches a threshold, I can simply create a separate rule (or a custom monitor type and a monitor), using the same data source. If the input parameters of the data source is the same as the existing performance collection rule, the data source should only run once for multiple workflows because of the Cookdown feature.
- If the SCOM agent computer is in maintenance mode when the perf collection rule is scheduled to run, no perf data will be collected and the computer will be missing from the report.
- In my example, I’m using a PowerShell script. So PowerShell and it’s execution policy needs to be installed / enabled on the SCOM agent computers. if this doesn’t meet your requirement, just modify the module to use a VBscript instead. I’ve blogged previously on how to create trigger only probe action modules for VBScript.
Again, the sample MP and the Report Definition RDL file can be downloaded HERE.
Leave a comment