OpsMgr Self Maintenance Management Pack 2.5.0.0
![]() 26/10/2015 Update: It has been identified the unsealed override MP was not included in the download, and also there was a small error in “Known Issue” section (section 8) of the MP guide. Therefore I have just updated the download which now included the override MP and updated MP guide. However, if you have already downloaded the version 2.5.0.1, and only after the override MP, you can download it from HERE.
26/10/2015 Update: It has been identified the unsealed override MP was not included in the download, and also there was a small error in “Known Issue” section (section 8) of the MP guide. Therefore I have just updated the download which now included the override MP and updated MP guide. However, if you have already downloaded the version 2.5.0.1, and only after the override MP, you can download it from HERE.
18/09/2015 Update: A bug has been identified in version 2.5.0.0, where the newly added Data Warehouse DB staging tables row count performance collection rules is causing issues with the Exchange Correlation service from the of Exchange MP (Please refer to the comment section of this post) because the rule category is set to “None”. I have updated the category of these performance collection rules in both the Self Maintenance MP and the OMS Add-On MP. Please re-download the MP (version 2.5.0.1) if you have already downloaded it and you are using Exchange MP in your environment.
Introduction
I can’t believe it has been 1 year and 3 month since the OpsMgr Self Maintenance MP was lastly updated. This is partially because over the last year or so, I have been spending a lot of time developing the OpsMgr PowerShell / SMA module OpsMgrExtended and am stilling working on the Automating OpsMgr blog series. But I think one of the main reasons is that I did not get too many new ideas for the next release. I have decided to start working on version 2.5 of the Self Maintenance MP few weeks ago, when I realised I have collected enough resources for a new release. So, after few weeks of development and testing, I’m pleased to announce the version 2.5 is ready for the general public.
What’s new in version 2.5?
- Bug Fix: corrected “Collect All Management Server SDK Connection Count Rule” where incorrect value may be collected when there are gateway servers in the management group.
- Additional Performance Rules for Data Warehouse DB Staging Tables row count.
- Additional 2-State performance monitors for Data Warehouse DB Staging Tables row count.
- Additional Monitor: Check if all management servers are on the same patch level
- Additional discovery to replace the built-in “Discovers the list of patches installed on Agents” discovery for health service. This additional discovery also discovers the patch list for OpsMgr management servers, gateway servers and SCSM servers.
- Additional Agent Task: Display patch list (patches for management servers, gateway servers, agents and web console servers).
- Additional Agent Task: Configure Group Health Rollup
- Updated “OpsMgr 2012 Self Maintenance Detect Manually Closed Monitor Alerts Rule” to include an option to reset any manually closed monitor upon detection.
- Additional Rule: “OpsMgr 2012 Self Maintenance Audit Agent Tasks Result Event Collection Rule”
- Additional Management Pack: “OpsMgr Self Maintenance OMS Add-On Management Pack”
To summarise, in my opinion, the 2 biggest features shipped in this release are the workflows built around managing OpsMgr Update Rollup patch level, and the extension to Microsoft Operations Management Suite (OMS) for the management groups that have already been connected to OMS via the new OpsMgr Self Maintenance OMS Add-On MP .
I will now briefly go though each item from the list above. The detailed documentation can be found in the updated MP guide.
Bug Fix: Total SDK Connection Count Perf Rule
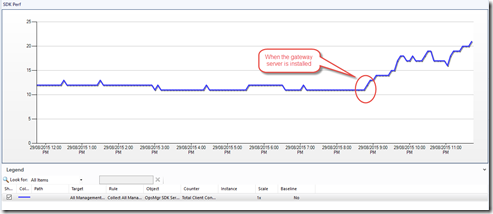
In previous version, the PowerShell script used by the “Collect All Management Server SDK Connection Count Rule” had a bug, where the incorrect count could be collected when there are gateway servers in the management group. i.e.
As shown above, when I installed a gateway server in my management group, the counter value has become incorrect and has increased significantly. This issue is now fixed.
Monitoring and Collecting the Data Warehouse DB staging tables row count
Back in the MVP Summit in November last year, my friend and fellow MVP Bob Cornelissen suggested me to monitor the DW DB staging tables row count because he has experienced issues where large amount of data were stuck in the staging tables (http://www.bictt.com/blogs/bictt.php/2014/10/10/case-of-the-fast-growing). Additionally, I have already included the staging tables row count in the Data Warehouse Health Check script which was released few months ago.
In this release, the MP comes with a performance collection rule and a 2-state performance threshold monitor for each of these 5 staging tables:
- Alert.AlertStage
- Event.EventStage
- ManagedEntityStage
- Perf.PerformanceStage
- State.StateStage
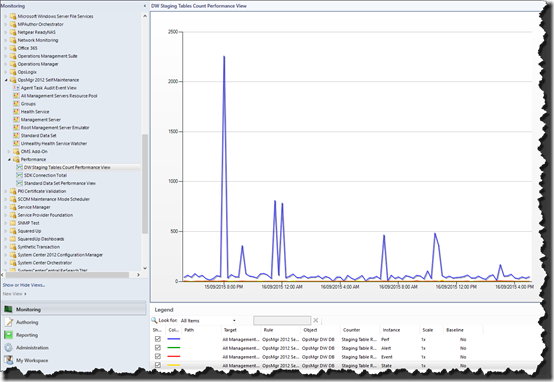
The performance collection rules collect the row count as performance data and store the data in both operational DB and the Data Warehouse DB:
The 2-State performance threshold monitors will generate critical alerts when the row count over 1000.
Managing OpsMgr Update Rollup Patch Level
Over the last 12 months, I have heard a lot of unpleasant stories caused by inconsistent patch levels between different OpsMgr components. In my opinion, currently we have the following challenges when managing updates for OpsMgr components:
People do not follow the instructions (aka Mr Holman’s blog posts) when applying OpsMgr updates.
Any seasoned OpsMgr folks would know wait for Kevin Holman’s post for the update when a UR is released, and the order for applying the UR is also critical. However, I have seen many times that wrong orders where followed or some steps where skipped during the update process (i.e. SQL update scripts, updating management packs, etc.)
OpsMgr management groups are partially updates due to the (mis)configuration of Windows Update (or other patching solutions such as ConfigMgr).
I have heard situations where a subset of management servers were updated by Windows Update, and the patch level among management servers themselves, as well as between servers and agents are different. Ideally, all management servers should be patched together within a very short time window (together with updating SQL DBs and management packs), and agents should also be updated ASAP. Leaving management servers in different patch levels would cause many undesired issues.
It is hard to identify the patch level for management servers
Although OpsMgr administrators can verify the patch list for the agent by creating a state view for agents and select “Patch List” property, the patch list property for OpsMgr management servers and gateway servers are not populated in OpsMgr. This is because the object discovery of which is responsible for populating this property only checks the patch applied to the MSI of the OpsMgr agent. Additionally, after the update rollup has been installed on OpsMgr servers, it does not show up in the Program and Features in Windows Control Panel. Up to date, the most popular way to check the servers patch level is by checking the version of few DLLs and EXEs. Due to these difficulties, people may not even aware of the inconsistent patch level within the management group because it is not obvious and it’s hard to find out.
In order to address some of these issues, and helping OpsMgr administrators to better manage the patch level and patching process, I have created the following items in this release of the Self Maintenance MP:
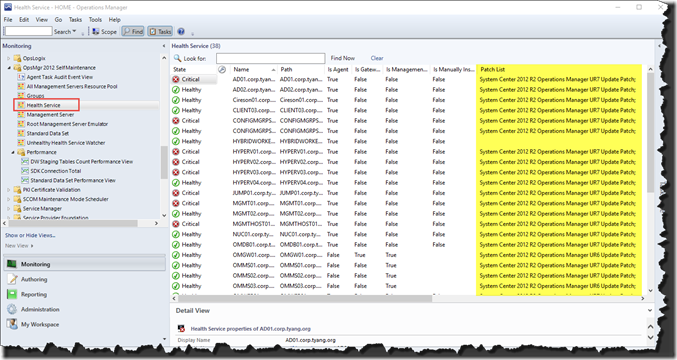
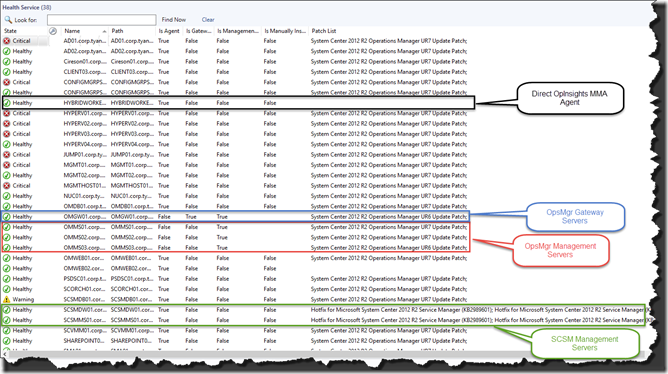
State view for Health Service which also displays the patch list:
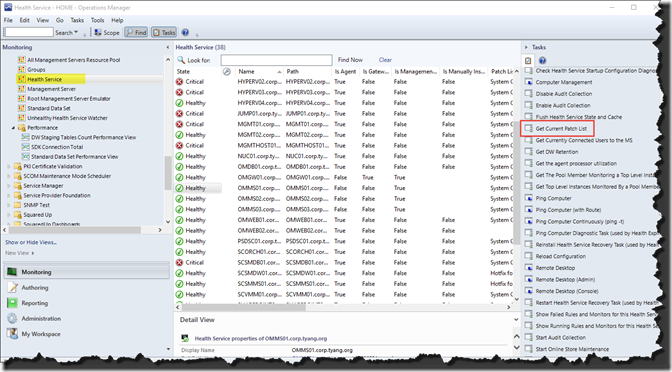
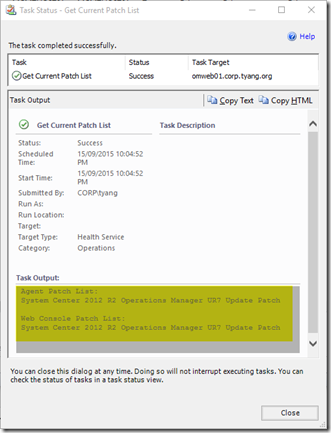
An agent task targeting Health Service to list OpsMgr components patch level:
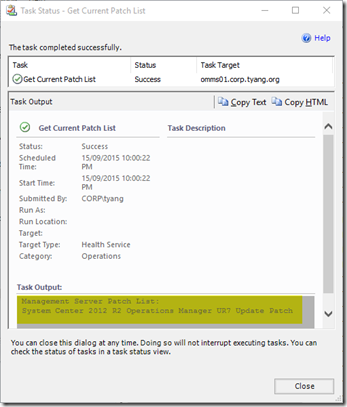
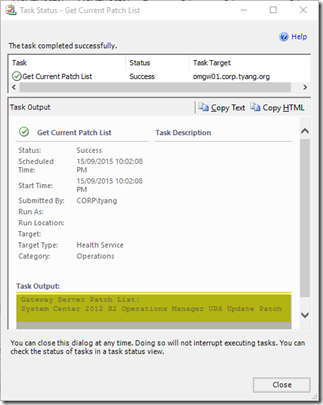
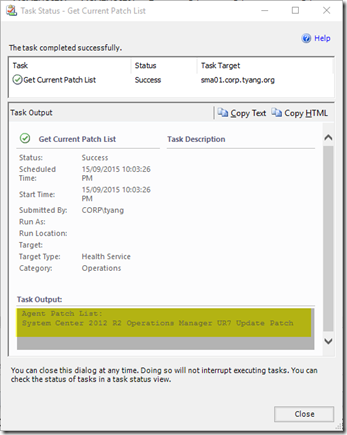
Because the “Patch List” property is populated by an object discovery, which only runs infrequently, in order to check the up-to-date information(of the patch list), I have created a task called “Get Current Patch List”, which is targeting the Health Service class. This task will display the patch list for any of the following OpsMgr components installed on the selected health service:
| Management Servers | Gateway Servers: |
| Agents | Web Console (also has agent installed): |
Object Discovery: OpsMgr 2012 Self Maintenance Management Server and Agent Patch List Discovery
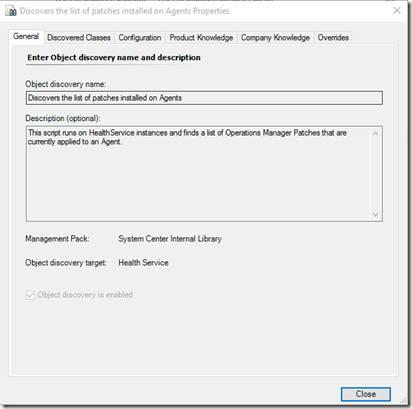
Natively in OpsMgr, the agent patch list is discovered by an object discovery called “Discovers the list of patches installed on Agents”:
As the name suggests, this discovery discovers the patch list for agents, and nothing else. It does not discover the patch list for OpsMgr management servers, gateway servers, and SCSM management servers (if they are also monitored by OpsMgr using the version of the Microsoft Monitoring Agent that is a part of the Service Manager 2012). On the other hand, this discovery provided by the OpsMgr 2012 Self Maintenance MP (Version 2.5.0.0) is designed to replace the native patch list discovery. Instead of only discovering agent patch list, it also discovers the patch list for OpsMgr management servers, gateway servers, SCSM management servers and SCSM Data Warehouse management servers.
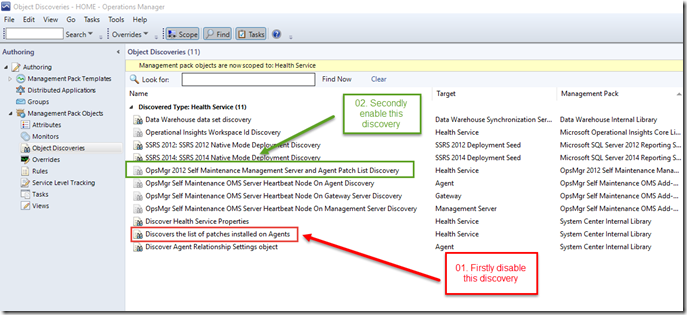
Same as all other workflows in the Self Maintenance MP, this discovery is disabled by default. In order to start using this discovery, please disable the built-in discovery “Discovers the list of patches installed on Agents” BEFORE enabling “OpsMgr 2012 Self Maintenance Management Server and Agent Patch List Discovery”:
Shortly after the built-in discovery has been disabled and the “OpsMgr 2012 Self Maintenance Management Server and Agent Patch List Discovery” has been enabled for the Health Service class, the patch list for the OpsMgr management servers, gateway servers and SCSM management servers (including Data Warehouse management server) will be populated (as shown in the screenshot below):
Note:
As shown above, the patch list for different flavors of Health Service is properly populated, with the exception of the Direct Microsoft Monitoring Agent for OpInsights (OMS). This is because at the time of writing this post (September, 2015), Microsoft has yet released any patches to the OMS direct MMA agent. The last Update Rollup for the Direct MMA agent is actually released as an updated agent (MSI) instead of an update (MSP). Therefore, since there is no update to the agent installer MSI, the patch list is not populated.
Warning:
Please do not leave both discoveries enabled at the same time as it will cause config-churn in your OpsMgr environment.
Monitor: OpsMgr 2012 Self Maintenance All Management Servers Patch List Consistency Consecutive Samples Monitor
This consecutive sample monitor is targeting the “All Management Servers Resource Pool” and it is configured to run every 2 hours (7200 seconds) by default. It executes a PowerShell script which uses WinRM to remotely connect to each management server and checks if all the management servers are on the same UR patch level.
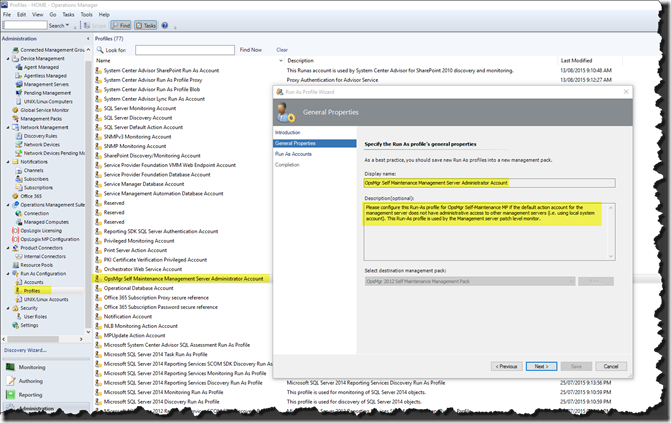
In order to utilise this monitor, WinRM must be enabled and configured to accept connections from other management servers. The quickest way to do so is to run “Winrm QuickConfig” on these servers. The account that is running the script in the monitor must also have OS administrator privilege on all management servers (by default, it is running under the management server’s default action account). If the default action account does not have Windows OS administrator privilege on all management servers, a Run-As profile can be configured for this monitor:
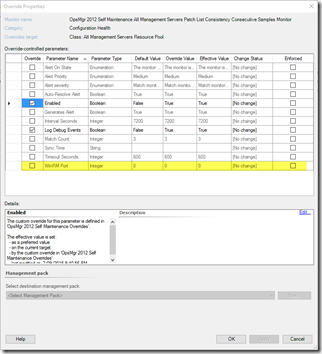
In addition to the optional Run-As profile, if WinRM on management servers are listening to a non-default port, the port number can also be modified via override:
<Note: All management servers must be configured to use the same WinRM port. Using different WinRM port is not supported by the script used by the monitor.
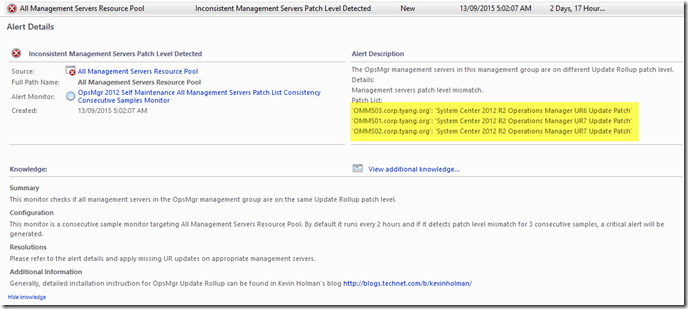
If the monitor detected inconsistent patch level among management servers in 3 consecutive samples, a Critical alert will be raised:
The number of consecutive sample can be modified via override (Match Count) parameter.
Agent Task: Configure group Health Rollup
This task has been previously released in the OpsMgr Group Health Rollup Task Management Pack. I originally wrote this task in response to Squared Up’s customers feedback. When I was developing the original MP (for Squared Up), Squared Up has agreed for me to release it to the public free of charge, as well as making this as a part of the new Self Maintenance MP.
Therefore, this agent task is now part of the Self Maintenance MP, kudos Squared Up ![]() .
.
Auditing Agent Tasks Execution Status
In OpsMgr, the task history is stored in the operational DB, which has a relatively short retention period. In this release, I have added a rule called “OpsMgr 2012 Self Maintenance Audit Agent Tasks Result Event Collection Rule”. it is designed to collect the agent task execution result and store it in both operational and Data Warehouse DB as event data. Because the data in the DW database generally has a much longer retention, the task execution results can be audited and reported.
Note: This rule was inspired by this blog post (although the script used in this rule is completely different than the script from this post): http://www.systemcentercentral.com/archiving-scom-console-task-status-history-to-the-data-warehouse/
Resetting Health for Manually Closed Monitor Alerts
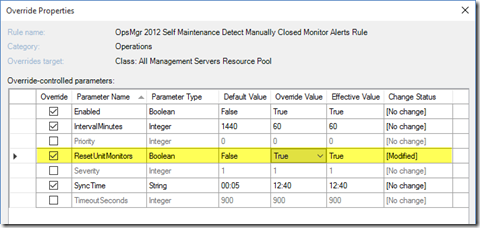
Having ability to automatically reset health state for manually closed monitor alerts must be THE most popular suggestion I have received for the Self Maintenance MP. I get this suggestions all the time, from the community, and also from MVPs. Originally, my plan was to write a brand new rule for this purpose. I then realised I already have created a rule to detect any manually closed monitor alerts. So instead of creating something brand new, I have updated the existing rule “OpsMgr 2012 Self Maintenance Detect Manually Closed Monitor Alerts Rule”. In this release, this rule now has an additional overrideable parameter called “ResetUnitMonitors”. This parameter is set to “false” by default. But when it is set to “true” via overrides, the script used by this rule will also reset the health state of the monitor of which generated the alert if the monitor is a unit monitor and its’ current health state is either warning or error:
OpsMgr Self Maintenance OMS Add On MP
OK, we all have to admit, OMS is such a hot topic at the moment. Hopefully you all have played and read about this solution (if not, you can learn more about this product from Mr Pete Zerger’s survival guide for OMS:http://social.technet.microsoft.com/wiki/contents/articles/31909.ms-operations-management-suite-survival-guide.aspx)
With the release of version 2.5.0.0, the new “OpsMgr Self Maintenance OMS Add-On Management Pack” has been introduced.
This management pack is designed to also send performance and event data generated by the OpsMgr 2012 Self Maintenance MP to the Microsoft Operations Management Suite (OMS) Workspace.
In addition to the existing performance and event data, this management pack also provides 2 event rules that send periodic “heartbeat” events to OMS from configured health service and All Management Servers Resource Pool. These 2 event rules are designed to monitor the basic health of the OpsMgr management group from OMS (Monitor the monitor scenario).
Note: In order to use this management pack, the OpsMgr management must meet the minimum requirements for the OMS / Azure Operational Insights integration, and the connection to OMS must be configured prior to importing this management pack.
Sending Heartbeat Events to OMS
There have been many discussion and custom solutions on how to monitor the monitor? It is critical to be notified when the monitor - OpsMgr management group is “down”. With the recent release of Microsoft Operations Management Suite (OMS) and the ability to connect the on-premise OpsMgr management group to OMS workspace, the “OpsMgr Self Maintenance OMS Add-On Management Pack” provides the ability to send “heartbeat” events to OMS from
- All Management Servers Resource Pool (AMSRP)
- Various Health Service
- Management Servers and Gateway Servers
- Agents
The idea behind these rules is that once the resource pool and management servers have started sending heartbeat events to OMS every x number of minutes, we will then be able to detect when the expected heartbeat events are missing, thus detecting potential issues within OpsMgr – thus monitoring the monitor.
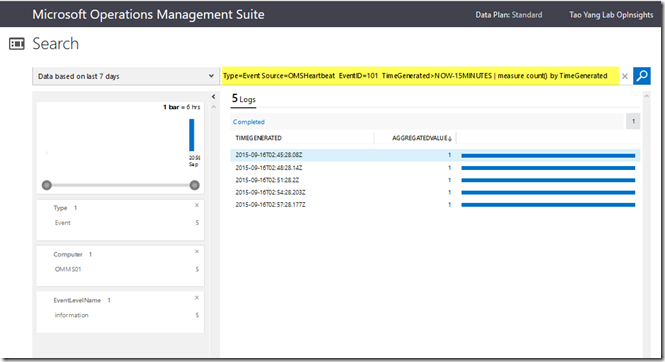
The heartbeat events can be accessed via the the OMS web portal (as well as using the OMS search API):
i.e. the AMSRP heartbeat events for the last 15 minutes:
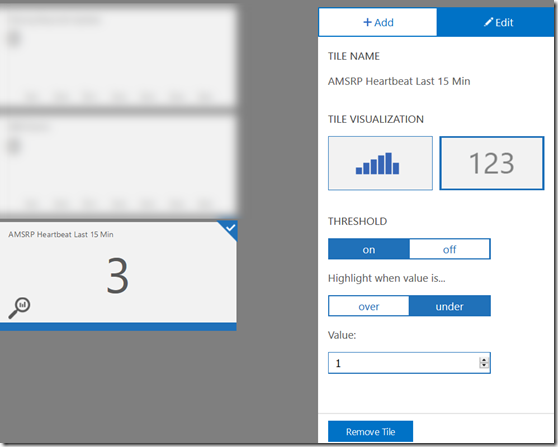
Dashboard tile with threshold:
Note: For the heartbeat event rule targeting the health service, I have configured it to continue sending the heartbeat even when the Windows computer has been placed into maintenance mode (not that management servers should ever been placed in maintenance mode in the first place
).
I’m not going to take all the credit for this one. Monitoring the monitor using OMS was an idea from my friend and fellow MVP Cameron Fuller. as the result of this discussion with Cameron and other CDM MVPs, I ended up developed a management pack which sends heartbeat events from AMSRP and selected health service (management servers for example) to OMS. This management pack has never been published to the public, but I believe Cameron has recently demonstrated it in the Minnesota System Center User Group meeting (http://blogs.catapultsystems.com/cfuller/archive/2015/08/14/summary-from-the-mnscug-august-2015-meeting/)
Please refer to the MP guide section 7.1 for detailed information about this feature.
Collecting Data Generated by the OpsMgr 2012 Self Maintenance MP
Other than the heartbeat event collection rules, the OMS Add-On MP also collects the following event and performance data to OMS:
- Data Warehouse Database Aggregation Outstanding dataset count (Perf Data)
- Data Warehouse Database Staging Tables Row Count (Perf Data)
- All Management Server SDK Connection Count (Perf Data)
- OpsMgr Self Maintenance Health Service OMS Heartbeat Event Rule
- Agent Tasks Result Audit (Event Data)
The above listed data are already being generated by the OpsMgr 2012 Self Maintenance MP, The OMS Add-On MP fully utilise Cook Down feature, and store these data in OMS in additional to the OpsMgr databases.
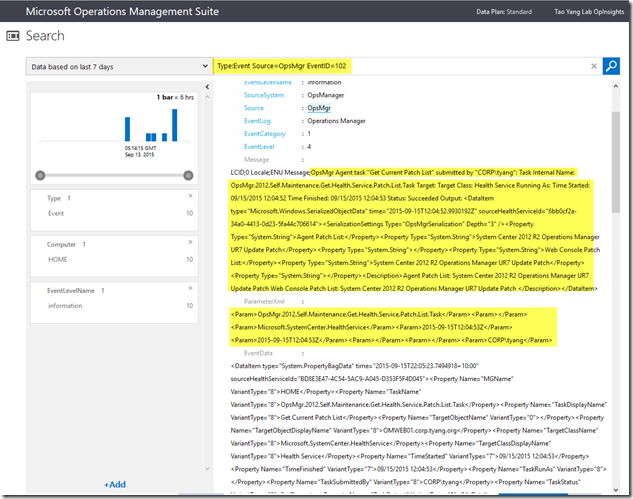
i.e. Agent Task Results Audit Event:
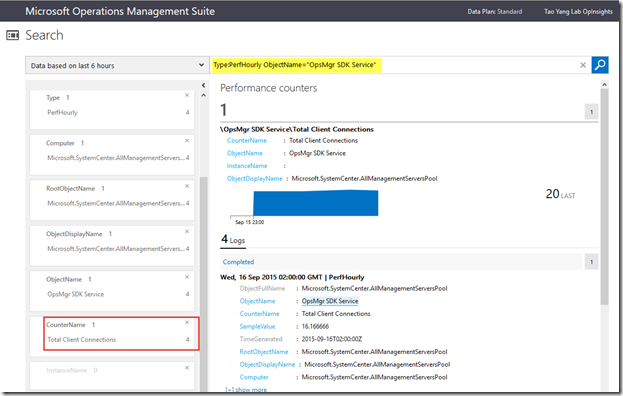
SDK Connection Count Perf Data:
Please refer to the MP guide section 7.2 for more information (and sample search queries) about these OMS data collection rules.
Credit
There are simply too many people to thank. I have mentioned few names in this post, but if I attempt to mention everyone who’s given me feedback, advise and helped me testing, I’m sure I’ll miss someone.
So I’d like to thank the broader OpsMgr community for adopting this MP and for all the feedback and suggestions I’ve received.
What’s Next?
Well, my another short time goal is to create a Squared Up dashboard for this MP, and release it in Squared Up’s upcoming community dashboard site.
Speaking about the long time goal, my prediction is that the next release is probably going to be dedicated to OpsMgr 2016. I am planning to make a brand new MP for OpsMgr 2016 (instead of upgrading this build), so I am able to delete all the obsolete elements in the 2016 build. I will re-evaluate and test all the workflows in this MP, making sure it is still relevant for OpsMgr 2016.
Download
You can download this MP from Cookdown’s website HERE

Leave a comment