
OpsMgr Dashboard Fun: Performance Widget Using SquaredUp
I’m a big fan of SquaredUp Dashboard. I have implemented it for my current “day-time” employer Coles over a year ago on their OpsMgr 2007 environments and we have also included SquaredUp in the newly built 2012 R2 management groups. In my opinion, it is more flexible than the native web console as it uses HTML 5 rather than Silverlight and it runs on any browsers as well as mobile devices.
One of my favourite features is that SquaredUp has the capability to directly read data from the OpsMgr Data Warehouse DB. Traditionally, OpsMgr operators would have to run or schedule reports in order to access aged performance data. Based on my experience, I think in 9 out of 10 times, it’s a total waste of my time, people don’t even open those reports when they arrived in their inboxes. With SquaredUp, you can access the performance data for any given period as long as it’s within the retention period. – So I can direct users to access these data from SquaredUp whenever they want, without having me involved.
I had some spare time today so I have installed the latest version in my home lab today. And I managed to create a dashboard using the PowerShell Web Browser widget for less than 10 minutes:
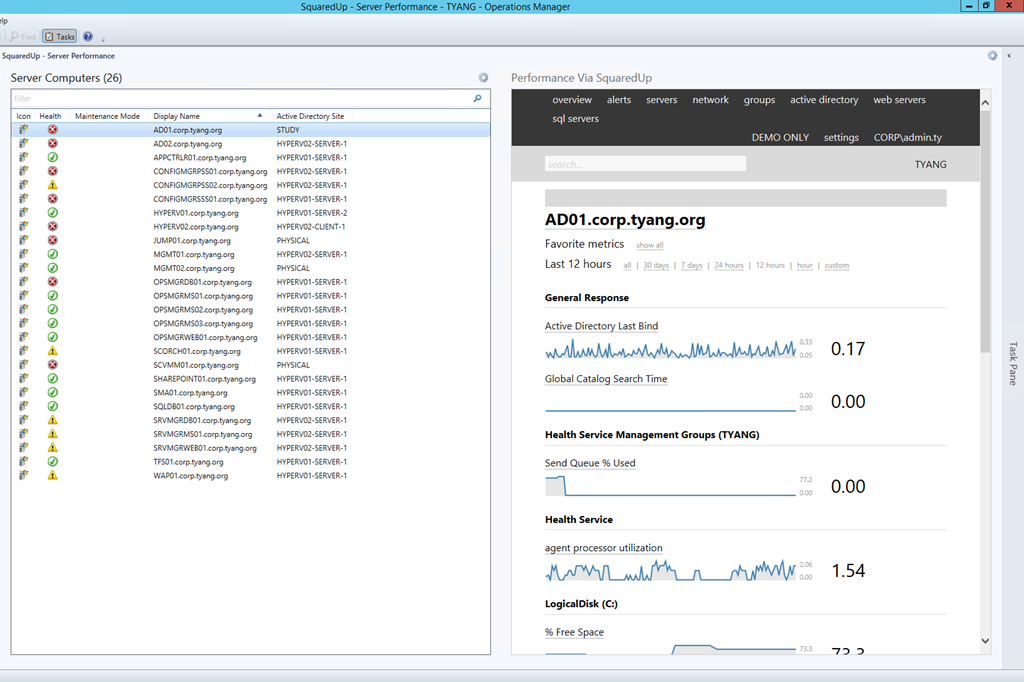
This dashboard contains 2 widgets. the left one is a state widget targeting Windows Server class. the widget on the right is a PowerShell Web Browser widget which has been made available since OpsMgr 2012 SP1 UR6 and SP2 UR2.
The script behind this widget is very simple. If you access the performance data of a server. the monitoring object ID and the timeframe are variables as part of the URL. so all I did is to pass these 2 variables. In this sample, I used the default timeframe of last 12 hours. you can specify other values if you like.
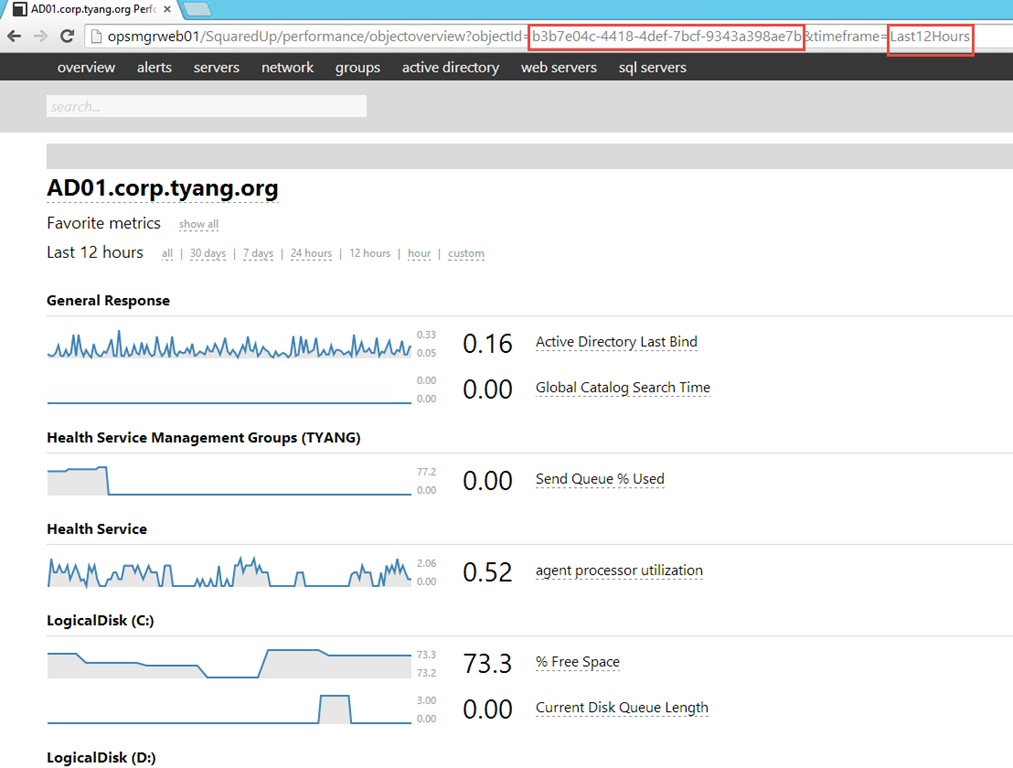
And here’s the script:
Param($globalSelectedItems)
$dataObject = $ScriptContext.CreateInstance("xsd://Microsoft.SystemCenter.Visualization.Component.Library!Microsoft.SystemCenter.Visualization.Component.Library.WebBrowser.Schema/Request")
$dataObject["BaseUrl"]="http://opsmgrweb01/SquaredUp/performance/objectoverview"
$parameterCollection = $ScriptContext.CreateCollection("xsd://Microsoft.SystemCenter.Visualization.Component.Library!Microsoft.SystemCenter.Visualization.Component.Library.WebBrowser.Schema/UrlParameter[]")
$bValid = $false
foreach ($globalSelectedItem in $globalSelectedItems)
{
  $parameter0 = $ScriptContext.CreateInstance("xsd://Microsoft.SystemCenter.Visualization.Component.Library!Microsoft.SystemCenter.Visualization.Component.Library.WebBrowser.Schema/UrlParameter")
  $parameter0["Name"] = "objectId"
  $parameter0["Value"] = $globalSelectedItem["Id"]

  $parameter1 = $ScriptContext.CreateInstance("xsd://Microsoft.SystemCenter.Visualization.Component.Library!Microsoft.SystemCenter.Visualization.Component.Library.WebBrowser.Schema/UrlParameter")
  $parameter1["Name"] = "timeframe"
  $parameter1["Value"] = "Last12Hours"
  $parameterCollection.Add($parameter0)
  $parameterCollection.Add($parameter1)
  $bValid = $true
}
If ($bValid)
{
  $dataObject["Parameters"]= $parameterCollection
  $ScriptContext.ReturnCollection.Add($dataObject)
}
Additionally, in order to make SquaredUp work in this dashboard, I had to configure the Data Warehouse DB connection and enable Single Sign-On according to the instructions below:
- Configure DW Connectiion: http://support.squaredup.com/support/solutions/articles/27999-configure-the-data-warehouse-connection
- Enable Single Sign-On: http://support.squaredup.com/support/solutions/articles/4136-enable-integrated-windows-authentication-single-sign
If you haven’t played with SquaredUp yet, please have take a look at their website: www.squaredup.com. there’s an online demo you can access too.
Leave a comment