SCOM: Process Performance Collection Rule for Services
Setting up Performance Collection rules for a particular process is pretty straightforward in SCOM. However, the it has it’s limitations.
Process performance collections rules are straightforward to setup, as long as there is ONLY ONE instance of the particular process running on the computers that your rule is targeting. Also, each rule can only collect ONE performance counter.
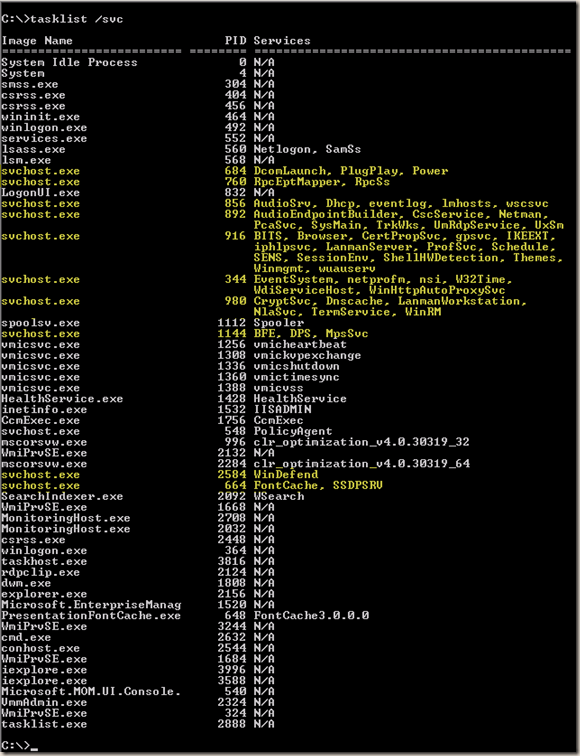
The problem with that is, if I need to collect performance counters for a particular service, i.e. Server Service (lanmanserver) or a particular SQL server instance (when there are multiple SQL instances running on the same server) , I will not be able to do so using the default performance collection module “System.Performance.OptimizedDataProvider” because server service runs under the generic service host svchost.exe. Typically, there are many instances of svchost.exe running for various services:
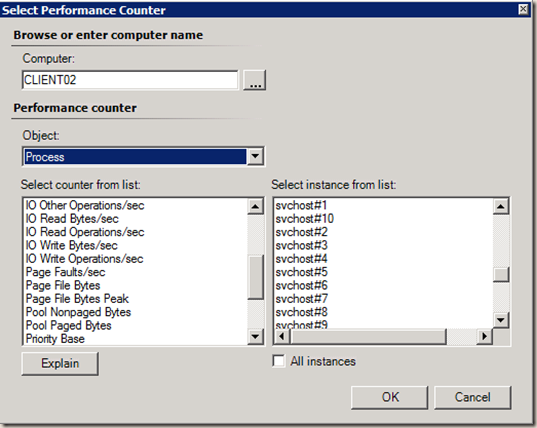
According to above screen capture, there are 10 instances of svchost.exe running on my computer. And when selecting performance counter in SCOM consoles, there are 10 instances of svchost:
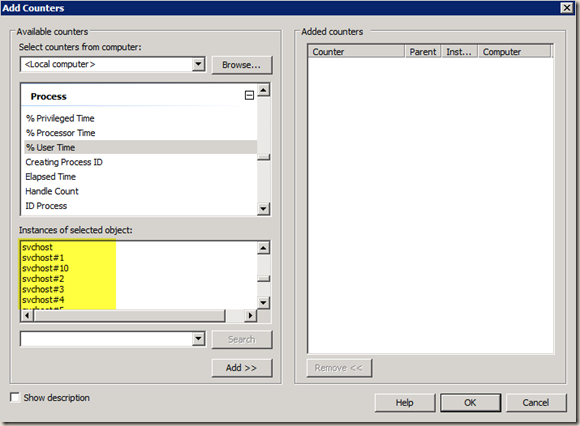
It’s the same if I simply run perfmon on the computer: there are 10 instances of svchost:
There’s actually a blog article on TechNet explaining this issue with perfmon: Perfmon: Identifying processes by PID instead of instance
So, there is a workaround for perfmon, but it doesn’t really help me with my performance collection rule in SCOM.
To overcome this issue, I had to create some customized modules to collect the counters that I’m interested in via WMI. I’ll now explain what I’ve done to achieve the goal.
- I firstly created a probe action module to run a vbscript to collect ALL the counters I’m interested in via WMI. In the script:
- takes the service name and computer name from the input parameter, get the PID for the service from win32_service class (note, I had to pass computer name to the script so it can connect to remote computer’s WMI namespace, this is required for agentless monitoring)
- retrieve the values of the performance counters from Win32_PerfFormattedData_PerfProc_Process class using query "Select * from Win32_PerfFormattedData_PerfProc_Process Where IDProcess = ProcessID" (ProcessID was retrieved from step 1)
- For each performance counter, create a property bag and add the property bag to MOM.ScriptAPI object
- Return all property bags.
- Create a Data Source module which contains 3 modules and the modules are executed on the following order:
- System.SimpleScheduler (runs according to a schedule)
- Probe module created from step 1 (retrieve performance counters and return then via property bag)
- System.Performance.DataGenericMapper (Map the property bag values to performance data)
Now that I’ve created all the required modules, I can then create a SINGLE rule to collect all different counters that I defined in the probe action module. To do so:
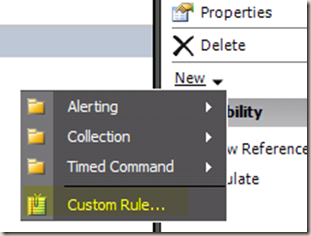
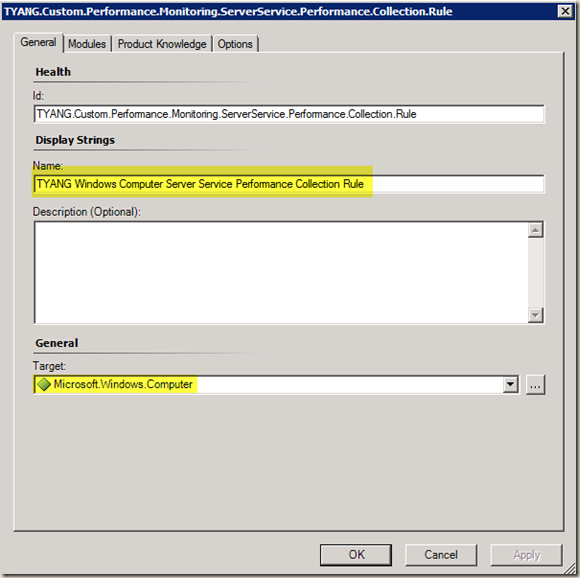
- In Authoring console, create a Custom Rule:
- Give the rule a name and choose the target:
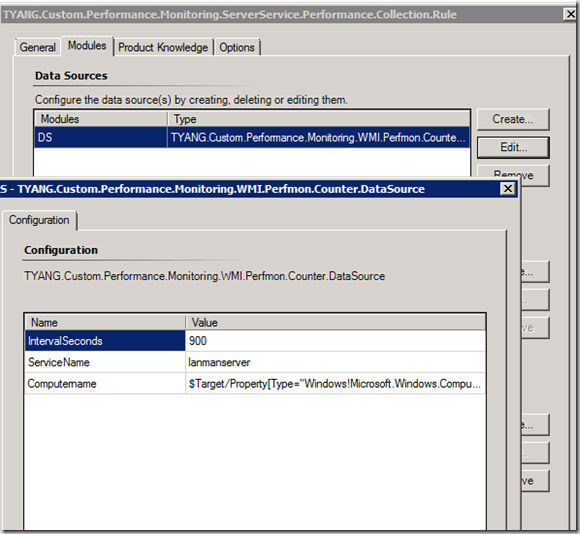
- Add the data source module I previously created and configure the variables (service name is the actual service name, NOT service display name):
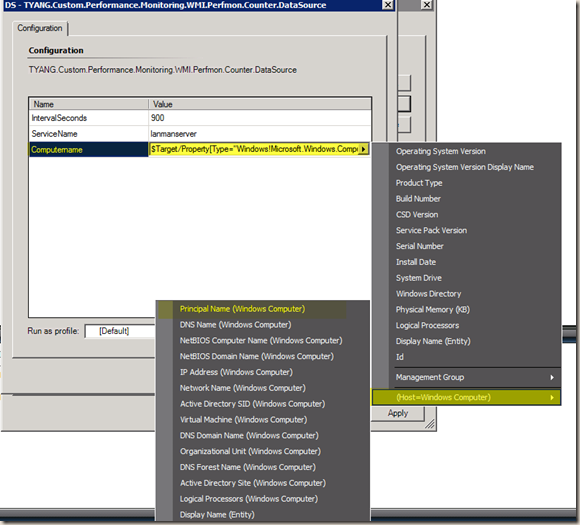
Note: The Computername variable from above example is “$Target/Property[Type=”Windows!Microsoft.Windows.Computer”]/PrincipalName$”, this is correct because I’m targeting the rule to Windows Computer. You will have to change it if you are targeting other classes. The best way is to use the prompt and choose the host’s principal name. Below is an example if I target the rule to Windows Operating System:
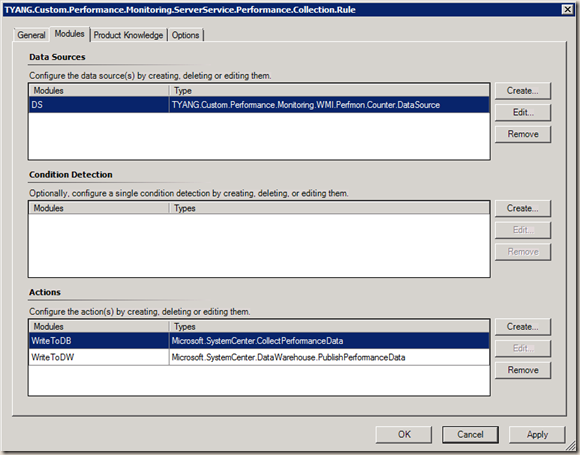
- Add 2 Actions module (don’t need to configure them):
- Microsoft.SystemCenter.CollectionPerformanceData (WriteToDB)
- Microsoft.SystemCenter.DataWarehouse.PublishPerformanceData (WriteToDW)
Note: The 2nd action module WriteToDW is from Microsoft.SystemCenter.DataWarehouse.Library. you will have to add this library as a reference of your management pack.
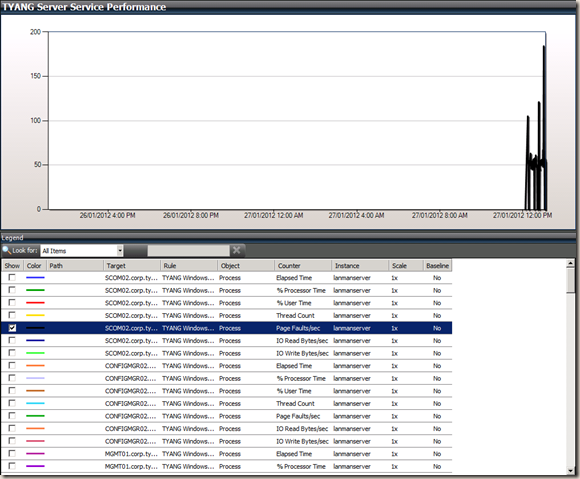
Now, the rule is created, you can create a performance view for the rule and make sure it is collecting data:
Below is the VBScript I’ve used in probe action module:
'=========================================================================
' AUTHOR:             Tao Yang
' Script Name:        ProcessPerfMonData.vbs
' DATE:               23/01/2012
' Version:            1.0
' COMMENT:            Script to collect perfmon data for specific service
'=========================================================================
Option Explicit
SetLocale("en-us")
Dim ServiceName, objWMIService,colService, objService, ComputerName
Dim ProcessID, ProcessName, colProcess, objProcess, colPerfData, objPerfData
Dim ElapsedTime, PercentProcessorTime, PercentUserTime, ThreadCount, PageFaultsPersec, IOReadBytesPersec, IOWriteBytesPersec
Dim oAPI, oBag, oInst
ServiceName = WScript.Arguments.Item(0)
ComputerName = Wscript.Arguments.Item(1)
Set oAPI = CreateObject("MOM.ScriptAPI")

Set objWMIService = GetObject("winmgmts:{impersonationLevel=impersonate}!\\" & ComputerName &"\root\cimv2")
Set colService = objWMIService.ExecQuery("Select * from Win32_Service Where Name = '" + ServiceName + "'")

For Each objService in colService
ProcessID = objService.ProcessID
Next

If ProcessID <> 0 THEN
Set colProcess = objWMIService.ExecQuery("Select * from Win32_Process Where ProcessID = " & ProcessID)
For Each objProcess in colProcess
ProcessName = objProcess.Name
Next
Set colPerfData = objWMIService.ExecQuery("Select * from Win32_PerfFormattedData_PerfProc_Process Where IDProcess = " & ProcessID)
For Each objPerfData in colPerfData
ElapsedTime = objPerfData.ElapsedTime
PercentProcessorTime = objPerfData.PercentProcessorTime
PercentUserTime = objPerfData.PercentUserTime
ThreadCount = objPerfData.ThreadCount
PageFaultsPersec = objPerfData.PageFaultsPersec
IOReadBytesPersec = objPerfData.IOReadBytesPersec
IOWriteBytesPersec = objPerfData.IOWriteBytesPersec
Next
'Elapsed Time
Set oBag = oAPI.CreatePropertyBag()
oBag.AddValue "Object", "Process"
oBag.AddValue "Instance", ServiceName
oBag.AddValue "Counter", "Elapsed Time"
oBag.AddValue "Value", ElapsedTime
oAPI.AddItem(oBag)

'Percent Processor Time
Set oBag = oAPI.CreatePropertyBag()
oBag.AddValue "Object", "Process"
oBag.AddValue "Instance", ServiceName
oBag.AddValue "Counter", "% Processor Time"
oBag.AddValue "Value", PercentProcessorTime
oAPI.AddItem(oBag)

'Percent User Time
Set oBag = oAPI.CreatePropertyBag()
oBag.AddValue "Object", "Process"
oBag.AddValue "Instance", ServiceName
oBag.AddValue "Counter", "% User Time"
oBag.AddValue "Value", PercentUserTime
oAPI.AddItem(oBag)

'Thread Count
Set oBag = oAPI.CreatePropertyBag()
oBag.AddValue "Object", "Process"
oBag.AddValue "Instance", ServiceName
oBag.AddValue "Counter", "Thread Count"
oBag.AddValue "Value", ThreadCount
oAPI.AddItem(oBag)

'Page Faults/Sec
Set oBag = oAPI.CreatePropertyBag()
oBag.AddValue "Object", "Process"
oBag.AddValue "Instance", ServiceName
oBag.AddValue "Counter", "Page Faults/sec"
oBag.AddValue "Value", PageFaultsPersec
oAPI.AddItem(oBag)

'IO Read Bytes/sec
Set oBag = oAPI.CreatePropertyBag()
oBag.AddValue "Object", "Process"
oBag.AddValue "Instance", ServiceName
oBag.AddValue "Counter", "IO Read Bytes/sec"
oBag.AddValue "Value", IOReadBytesPersec
oAPI.AddItem(oBag)

'IO Write Bytes/sec
Set oBag = oAPI.CreatePropertyBag()
oBag.AddValue "Object", "Process"
oBag.AddValue "Instance", ServiceName
oBag.AddValue "Counter", "IO Write Bytes/sec"
oBag.AddValue "Value", IOWriteBytesPersec
oAPI.AddItem(oBag)
ELSE
'Return an empty property bag
Set oBag = oAPI.CreatePropertyBag()
oAPI.AddItem(oBag)
END IF
oAPI.ReturnItems
As you can see, I’m collecting the following 7 counters in the script:
- Elapsed Time
- % Processor Time
- % User Time
- Thread Count
- Page Faults/sec
- IO Read Bytes/sec
- IO Write Bytes/sec
You will need to modify the script if you are collecting different counters. for details of the counters you can collect, please refer to Win32_PerfFormattedData_PerfProc_Process class documentation here at MSDN: http://msdn.microsoft.com/en-us/library/windows/desktop/aa394277(v=vs.85).aspx
I’ve attached the script and the sample unsealed management pack at the bottom of this article. You can modify or recreate your own based on the samples. don’t forget to seal the management pack if you want to use the modules in other MPs.
VBScript: ProcessPerfMonData.txt
Unsealed MP: TYANG.Custom.Performance.Monitoring.xml

Leave a comment