13/03/2015 Update: Correction after feedback from Squared Up, Squared Up does not read perf data from Operational DB. Thus this post is updated with the correct information.
Yesterday, my friend and fellow SCCDM MVP Cameron Fuller has posted a good article explaining the differences between performance view and performance widget in OpsMgr. If you haven’t read it, please read it first from here: World War Widget: The performance view vs the performance widget and come back to this article.
As Cameron explained, performance views read data from the operational DB and you can access the most recent short term data. The performance widgets read data from the Data Warehouse DB and you are able to access the long term historical data this way.
I’d also like to throw a 3rd option into the mix, however, this is not something native in OpsMgr, but it is via the 3rd party dashboard Squared Up.
To be honest, Access Performance data must be my most favourite feature in Squared Up. In this post, I will show off few features related to this topic in the Squared Up console.
01. Automatically Switch Between Data Sets
Since all performance collection rules write performance data into both databases, Squared Up only reads performance data from Data Warehouse DB. When accessing the performance data in Squared Up, as long as you have already established Data Warehouse DB connection, Squared Up will automatically detect the best aggregation set for the performance data. You can access both long term and short term data from a single view:
As shown above, the default period is 12 hours, the data displayed is the raw performance data (not aggregated), if I change the period to last 30 days, notice the performance counter name is also updated with “(hourly)” at the end – this means this graph is now based on the hourly aggregate dataset:
If I change the period again, this time, I select “all”, as shown below, it is showing about a year’s worth of data, and it has automatically switched to the daily aggregate dataset:
02. Accessing the numeric value from the graph
Other than being able to auto detect and switch to the more appropriate data source and data set, if you move the cursor to any point on the graph, you will be able to read the exact figure at that point of time:
03. Selecting a Period from the graph:
You can also highlight a period from the graph, and Squared Up will update the graph to only display the period you’ve just highlighted:
04. Exporting Performance Data to Excel
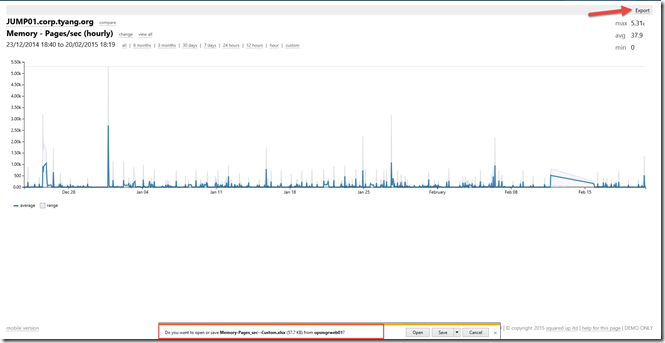
You can also export the data to Excel using the export button on the top right hand side of the page.
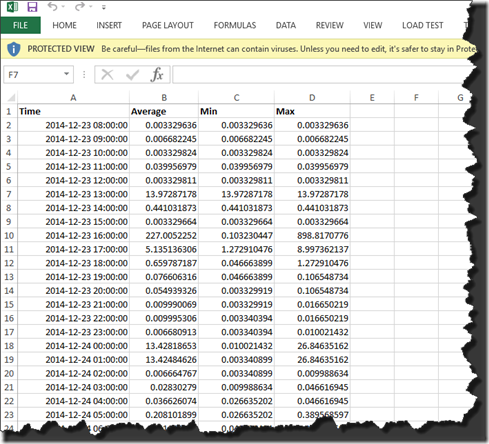
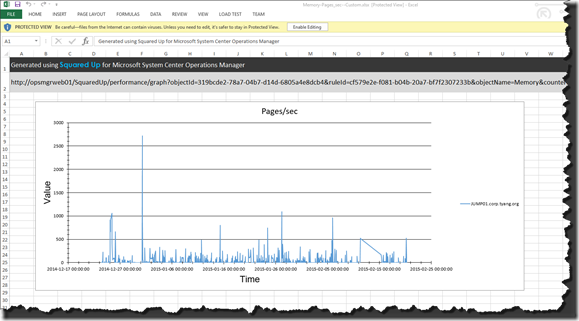
When you open the exported Excel document, you’ll see 2 tabs – one for the numeric data on a table, one for the graph itself:
Conclusion
This is all based on my own experience, just my 2 cents on the topic that Cameron has started. I think it would be good to also show the community what a 3rd party product can do in addition to the native capabilities.
If you haven’t played with Squared Up before, I strongly recommend you to go take a look: http://www.squaredup.com, you can access the online demo from their website too. They also have few demo videos that you can watch: http://squaredup.com/resources/videos/
Lastly, please feel free to drop me an email if you want to carry on this discussion.


Leave a comment