Using Squared Up As an Universal Dashboard Solution
Background
I’ve been playing with Squared Up a lot lately – to get myself familiar with the new 2.0 version, thus my recent few posts were all related to it.
few days ago, I was involved in a conversation around from SCOM users / consumers point view, how to bring data from multiple management groups into a single pane of glass. As the result of this conversation, I’ve spent some time and tried the Squared Up SQL Plugin. After couple of hours, I managed to produce 2 dashboards using this plugin, both using data sources that are foreign to the OpsMgr management group the Squared Up instance is connected to.
In this blog, I’ll go through the steps setting up the following dashboards:
- Active Alerts from another OpsMgr management group (data source: the OperationsManager DB from the other management group).
- ConfigMgr 2012 Package Distribution Dashboard (data source: ConfigMgr primary site DB).
I will demonstrate using the Squared Up 2.0 dashboard installed on the OpsMgr web console server in my home lab.
The foreign OpsMgr management group is hosted in my Azure subscription. All the servers used by this management group are connected to my home lab via a Azure S2S VPN connection. They are located on the same domain as my on-prem lab.
The ConfigMgr infrastructure is also located in my home lab (on-prem).
Pre-Requisites
Setting up DB access in SQL
Since the SQL connection string used by this plugin is stored in clear text, SquaredUp does not recommend using a username and password. Therefore, in the connection string, I’m using integrated security.
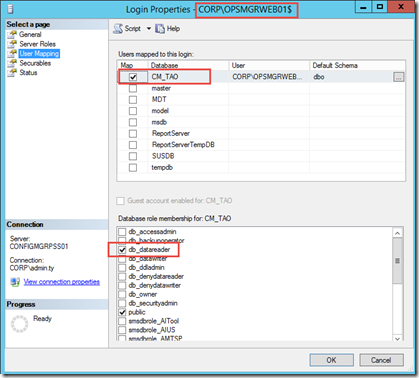
Since the SquaredUp IIS Application pool is running using the local NetworkService account, I must grant the SquaredUp web server’s computer account datareader access to the database that’s going to be used as the data source. i.e. for my ConfigMgr primary site DB:
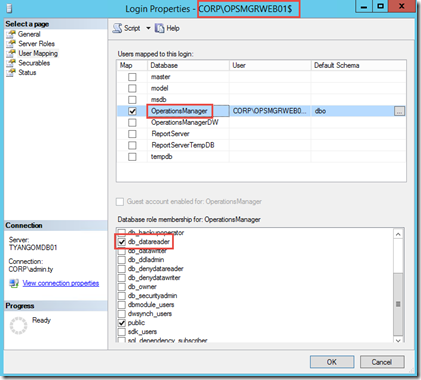
and for the OpsMgr operational DB:
Installing Squared Up SQL Plugin
You will need to install the latest version (2.0.2) of the plugin. if you have already installed it before, please make sure you update to this version. There was a bug in the earlier versions, and it has been fixed in 2.0.2.
ConfigMgr Package Distribution Dashboard
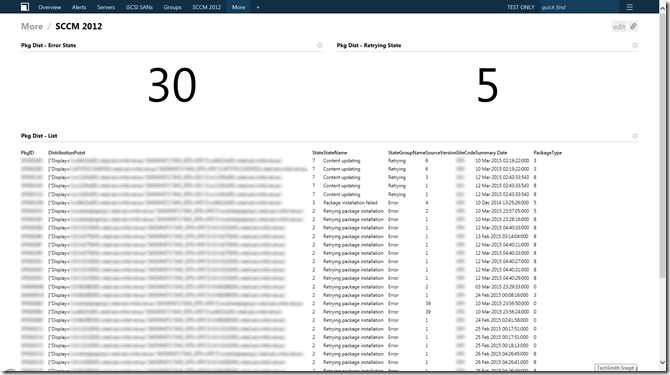
This dashboard contains 3 parts (two parts on the top, one on the bottom). the top 2 parts displays the a single number (how many package distributions are in error and retrying states). the bottom part is a list for all the distributions that are in these 2 states.
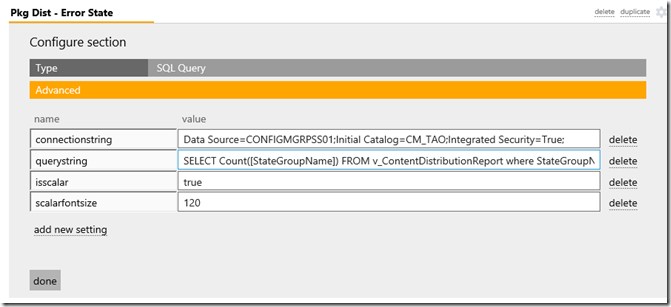
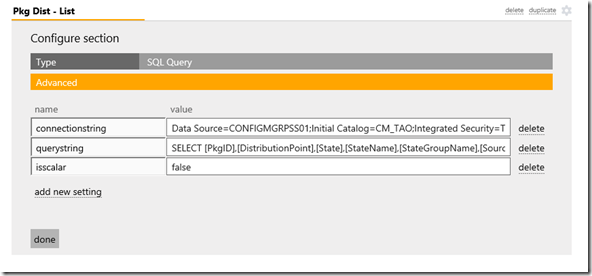
All 3 parts are using the SQL plugin, the connection string for all 3 parts are:
Data Source=
the top 2 parts are configured like this:
Pkg Dist - Error State part (Top left):
SQL query string:
SELECT Count([StateGroupName]) FROM v_ContentDistributionReport where StateGroupName = 'Error'
Pkg Dist – Retrying State part (Top right):
SQL query string:
SELECT Count([StateGroupName]) FROM v_ContentDistributionReport where StateGroupName = 'Retrying'
Other parameters:
- isscalar: true
- scalarfontsize: 120
Pkg Dist – List (Bottom):
SQL query string:
SELECT [PkgID],[DistributionPoint],[State],[StateName],[StateGroupName],[SourceVersion],[SiteCode],Convert(VARCHAR(24),[SummaryDate],113) as 'Summary Date',[PackageType] FROM v_ContentDistributionReport where StateGroupName <> 'Success' order by StateGroupName desc
other parameters:
- isscalar: false
Active Alerts Dashboard for a foreign OpsMgr MG
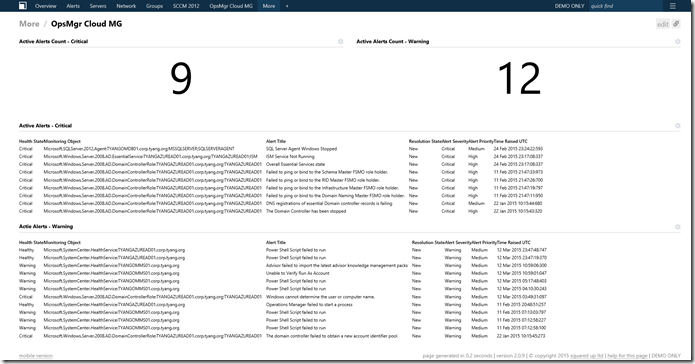
Similar to the previous sample, there are 2 parts on the top displaying scalar values. In this case, I’ve chosen to display the active alerts count for critical and warning alerts. Followed by the 2 big scalar numbers, I added 2 lists for active critical & warning alerts.
SQL connection strings:
Data Source=
Active Alert Count – Critical (Top left):
SQL query string:
select count(id) from [dbo].[AlertView] where ResolutionState <> 255 and severity = 2
- isscalar: true
- scalarfontsize: 120
Active Alert Count – Warning (Top right):
SQL query string:
select count(id) from [dbo].[AlertView] where ResolutionState <> 255 and severity = 1
- isscalar: true
- scalarfontsize: 120
Active Alerts – Critical (list):
SQL query string:
SELECT Case a.[MonitoringObjectHealthState] When 0 Then 'Not Monitored' When 1 Then 'Healthy' When 2 Then 'Warning' When 3 Then 'Critical' END As 'Health State', a.[MonitoringObjectFullName] as 'Monitoring Object',a.[AlertStringName] as 'Alert Title',r.ResolutionStateName as 'Resolution State',Case a.Severity When 0 Then 'Information' When 1 Then 'Warning' When 2 Then 'Critical' END As 'Alert Severity', Case a.Priority When 0 Then 'Low' When 1 Then 'Medium' When 2 Then 'High' END As 'Alert Priority',Convert(VARCHAR(24),a.[TimeRaised],113) as 'Time Raised UTC' FROM [dbo].[AlertView] a inner join dbo.ResolutionStateView r on a.ResolutionState = r.ResolutionState where a.ResolutionState <> 255 and a.severity = 2 order by a.TimeRaised desc
- isscalar: false
- tableshowheaders: true
Active Alerts – Warning (list):
SQL query string:
SELECT Case a.[MonitoringObjectHealthState] When 0 Then 'Not Monitored' When 1 Then 'Healthy' When 2 Then 'Warning' When 3 Then 'Critical' END As 'Health State', a.[MonitoringObjectFullName] as 'Monitoring Object',a.[AlertStringName] as 'Alert Title',r.ResolutionStateName as 'Resolution State',Case a.Severity When 0 Then 'Information' When 1 Then 'Warning' When 2 Then 'Critical' END As 'Alert Severity', Case a.Priority When 0 Then 'Low' When 1 Then 'Medium' When 2 Then 'High' END As 'Alert Priority',Convert(VARCHAR(24),a.[TimeRaised],113) as 'Time Raised UTC' FROM [dbo].[AlertView] a inner join dbo.ResolutionStateView r on a.ResolutionState = r.ResolutionState where a.ResolutionState <> 255 and a.severity = 1 order by a.TimeRaised desc
- isscalar: false
- tableshowheaders: true
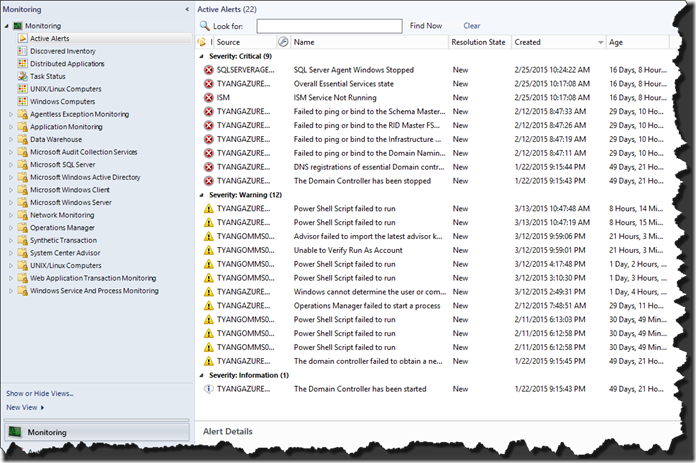
As shown in the dashboard screenshot above, currently I have 9 critical and 12 warning alerts in the MG on the cloud, this figure matches what’s showing in the Operations console:
Conclusion
By using the Squared Up SQL plugin, you can potentially turn Squared UP into a dashboard for any systems (not just OpsMgr). The limit is your imagination ![]() . I have also written few posts on Squared Up before, you can find them here: https://blog.tyang.org/tag/squaredup/
. I have also written few posts on Squared Up before, you can find them here: https://blog.tyang.org/tag/squaredup/
Lastly, I encourage you to share your brilliant ideas with the rest of us, and I will for sure keep posting on this topic if I come up with something cool in the future.

Leave a comment