Collecting ConfigMgr Logs To Microsoft Operation Management Suite – The NiCE way
Introduction
I have been playing with Azure Operational Insights for a while now, and I am really excited about the capabilities and capacities it brings. I haven’t blogged anything about OpInsights until now, largely because all the wonderful articles that my MVP friends have already written. i.e. the OpInsights series from Stanislav Zheyazkov (at the moment, he’s written 18 parts so far!): https://cloudadministrator.wordpress.com/2015/04/30/microsoft-azure-operational-insights-preview-series-general-availability-part-18-2/
Back in my previous life, when I was working on ConfigMgr for living, THE one thing that I hate the most, is reading log files, not to mention all the log file names, locations, etc. that I have to memorise. I remember there was even a spreadsheet listing all the log files for ConfigMgr. Even until now, when I see a ConfigMgr person, I’d always ask “How many log files did you read today?” – as a joke. However, sometimes, when sh*t hits the fan, people won’t see the funny side of it. In my opinion, based on my experience working on ConfigMgr, I see the following challenges in ConfigMgr log files:
There are too many of them!
And even for a same component, there would be multiple log files (i.e. for software update point, there are wsyncmgr.log, WCM.log, etc.). Often administrators have to cross check entries from multiple log files to identify the issue.
Different components place log files in different locations
Site server, clients, management points, distribution points, PXE DPs, etc. all save logs to different locations. not to mention when you some of these components co-exist on the same machine, the log locations would be different again (i.e. client logs location on the site server is different than the normal clients).
Log file size is capped
By default, the size of each log file is capped to 2.5MB (I think). Although it keeps a copy of the previous log (renamed to .lo_ file), still, it holds totally 5MB of log data for the particular component. In a large / busy environment, or when something is not doing right, these 2 files (.log and .lo_) probably only holds few hours of data. Sometimes, by the time when you realised something went wrong and you need to check the logs, they have already been overwritten.
It is difficult to read
You need a special tool (CMTrace.exe) to read these log files. If you see someone reading ConfigMgr log files using notepad, he’s either really really good, or someone hasn’t been working on ConfigMgr for too long. For majority of people like us, we rely on CMTrace.exe (or Trace32.exe in ConfigMgr 2007) to read log files. When you log to a computer and want to read some log files (i.e. client log files), you’d always have to find a copy of CMTrace.exe somewhere on the network and copy it over to the computer that you are working on. In my lab, I even created an application in ConfigMgr to copy CMTrace.exe to C:\Windows\System32 and deployed to every machine – so I don’t have to manually copy it again and again. I’m sure this is a common practice and many people have all done this before.
Logs are not centralised
In a large environment where you ConfigMgr hierarchy consists of hundreds of servers, it is a PAIN to read logs on all of these servers. i.e. When something bad happens with OSD and PXE, the results can be catastrophic (some of you guys may still remember what an incorrectly advertised OSD task sequence has done to a big Australian bank few years back). Based on my own experience, I have seen support team needs to check PXE DP’s SMSPXE.log on as many as few hundred PXE enabled distribution points, within a very short time window (before the logs get overwritten). People would have to connect to each individual DP and read the log files one at a time. – In situation like this, if you go up to them and ask them “How many logs have you read today?”, I’m sure it wouldn’t go down too well.
It would be nice if…
When Microsoft has released Operational Insights (OpInsights) to preview, the first thing came to my mind is, would be very nice if we can collect and process ConfigMgr log files into OpInsights. This would bring the following benefits to ConfigMgr administrators:
- Logs are centralised and searchable
- Much longer retention period (up to 12 month)
- No need to use special tools such as CMTrace.exe to read the log files
- Being able to correlate data from multiple log files and multiple computers when searching, thus make administrator’s troubleshooting experience much easier.
Challenges
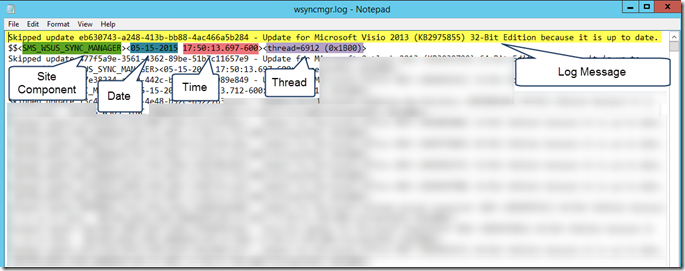
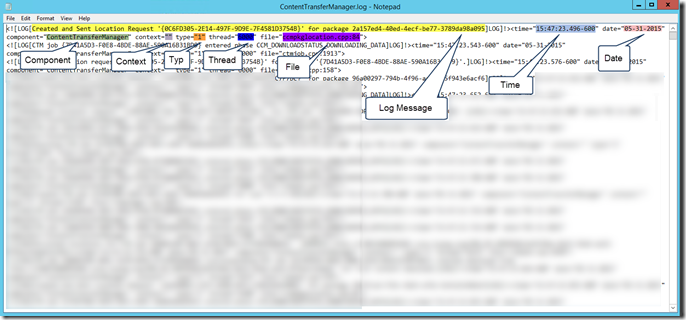
A line of ConfigMgr log entry consists of many piece of information. And the server and client log files have different format. i.e.
Server Log file:
Client Log File:
Before sending the information to OMS, we firstly must capture only the useful information from each entry, transform them into a more structured way (such as Windows Event log format), so these fields would become searchable once been stored and indexed in your OMS workspace.
No Custom Solution Packs available
Since OMS is still very new, there aren’t many Solution Packs available (aka Intelligence Packs in the OpInsights days). Microsoft has not yet released any SDKs / APIs for partners and 3rd parties to author and publish Solution Packs. Therefore, at this stage, in order to send the ConfigMgr log file entries to OMS, we will have to utilise our old friend OpsMgr 2012 (with OpInsights integration configured), leveraging the power of OpsMgr management packs to collect and process the data before sending to OMS (via OpsMgr).
OpsMgr Limitations
As we all know, OpsMgr provides a “Generic Text Log” event collection rule. But unfortunately, this native event data source is not capable of accomplish what I am going to achieve here.
NiCE Log File Management Pack
NiCE is a company based in Germany. They offer a free OpsMgr management pack for log file monitoring. There are already many good blog articles written about this MP, I will not write an introduction here. If you have never heard or used it, please read the articles listed below, then come back to this post:
SCOM 2012 – NiCE Log File Library MP Monitoring Robocopy Log File – By Stefan Roth
NiCE Free Log File MP & Regex & PowerShell: Enabling SCOM 2 Count LOB Crashes – By Marnix Wolf
SCOM - Free Log File Monitoring MP from NiCE –By Kevin Greene
The beauty about the NiCE Log File MP is, it is able to extract the important information (as I highlighted in the screenshots above) by using Regular Expression (RegEx), and present the data in a structured way (in XML).
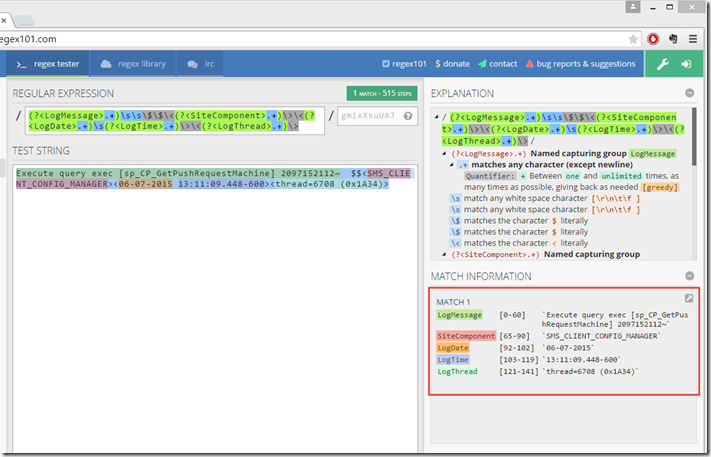
In Regular Expression, we are able to define named capturing groups to capture data from a string, this is similar to storing the information in a variable when comes to programming. I’ll use a log file entry from both ConfigMgr client and server logs, and my favourite Regular Expression tester site https://regex101.com/ to demonstrate how to extract the information as I highlighted above.
Server Log entry
Regular Expression:
(?<LogMessage>.+)\s\s\$\$\<(?<SiteComponent>.+)\>\<(?<LogDate>.+)\s(?<LogTime>.+)\>\<(?<LogThread>.+)\>
Sample Log entry:
Execute query exec [sp_CP_GetPushRequestMachine] 2097152112~ $$<SMS_CLIENT_CONFIG_MANAGER><06-07-2015 13:11:09.448-600><thread=6708 (0x1A34)>
RegEx Match:
Client Log entry:
Regular Expression:
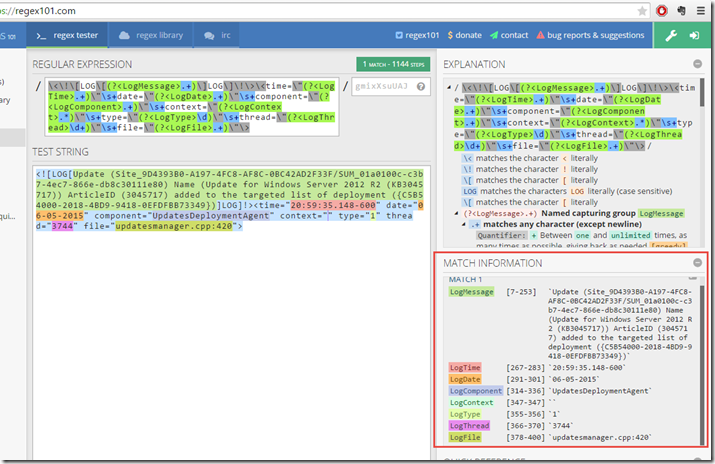
\<\!\[LOG\[(?<LogMessage>.+)\]LOG\]\!\>\<time=\"(?<LogTime>.+)\"\s+date=\"(?<LogDate>.+)\"\s+component=\"(?<LogComponent>.+)\"\s+context=\"(?<LogContext>.*)\"\s+type=\"(?<LogType>\d)\"\s+thread=\"(?<LogThread>\d+)\"\s+file=\"(?<LogFile>.+)\"\>
Sample Log entry:
<![LOG[Update (Site_9D4393B0-A197-4FC8-AF8C-0BC42AD2F33F/SUM_01a0100c-c3b7-4ec7-866e-db8c30111e80) Name (Update for Windows Server 2012 R2 (KB3045717)) ArticleID (3045717) added to the targeted list of deployment ({C5B54000-2018-4BD9-9418-0EFDFBB73349})]LOG]!><time="20:59:35.148-600" date="06-05-2015" component="UpdatesDeploymentAgent" context="" type="1" thread="3744" file="updatesmanager.cpp:420">
RegEx Match:
NiCE Log MP Regular Expression Tester
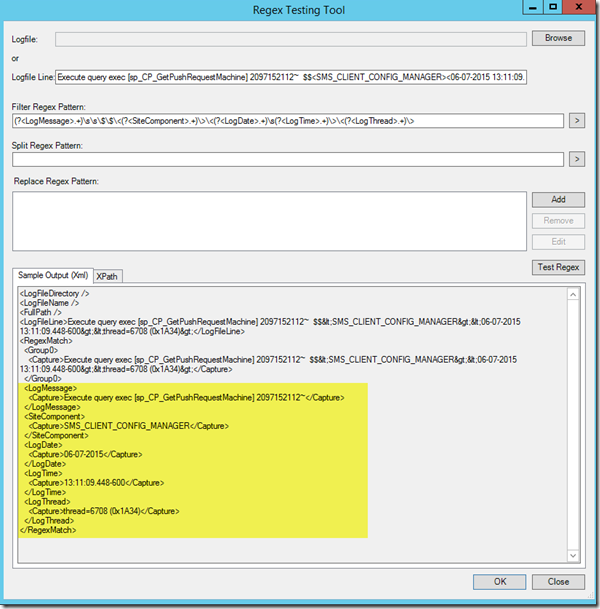
The NiCE Log MP also provides a Regular Expression Tester UI in the management pack. The good thing about this RegEx tester is, it also shows you what the management pack module output would be (in XML and XPath):
Now, I hope you get the bigger picture of what I want to achieve now. I want to use OpsMgr 2012, NiCE Log File MP to collect various ConfigMgr 2012 log files (both client and server logs), and then send over to OMS via OpsMgr. It is now time to talk about the management packs.
Management Pack
Obviously, the NiCE Log File MP is required. You can download it from NiCE’s customer portal once registered. This MP must be firstly imported into your management group.
Additionally, your OpsMgr management group must be configured to connect to a Operational Insights (or called “System Center Advisor” if you haven’t patched your management group in the last few months). However, what I’m about to show you is also able to store the data in your on-prem OpsMgr operational and data warehouse databases. So, even if you don’t use OMS (yet), you are still able to leverage this solution to store your ConfigMgr log data in OpsMgr databases.
Management Pack 101
Before I dive into the MP authoring and configuration, I’d like to firstly spend some time to go through some management pack basics – at the end of the day, not everyone working in System Center writes management packs. By going through some of the basics, it will help people who haven’t previously done any MP development work understand better later on.
In OpsMgr, there are 3 types of workflows:
- Object Discoveries – For discovering instances and it’s properties of classes defined in management packs.
- Monitors – responsible for the health states of monitoring objects. Can be configured to generate alerts.
- Rules – Not responsible for the objects health state. Can be used to collect information, and also able to generate alerts.
Since our goal is to collect information from ConfigMgr log files, it is obvious we are going to create some rules to achieve this goal.
A rule consists of 3 types of member modules:
- One(1) or more Data Source modules (beginning of the workflow)
- Zero(0) or One(1) Condition Detection Module (optional, 2nd phase of the workflow)
- One(1) or more write action modules (Last phase of the workflow).
To map the rule structure into our requirement, the rules we are going to author (one rule for each log file) is going to be something like this:
- Data Source module: Leveraging the NiCE Log MP to read and process ConfigMgr log entries using Regular Expression.
- Condition Detection module: Map the output of the Data Source Module into Windows event log data format
-
Write Action modules: write the Windows Event log formatted data to various data repositories. Depending your requirements, this could be any combinations of the 3 data repositories:
- OpsMgr Operational DB (On-Prem, short term storage, but able to access the data from the Operational Console)
- OpsMgr Data Warehouse DB (On-Prem, long term storage, able to access the data via OpsMgr reports)
- OMS workspace (Cloud based, long term or short term storage depending on your plan, able to access the data via OMS portal, and via Azure Resource Manager API.)
Using NiCE Log MP as Data Source
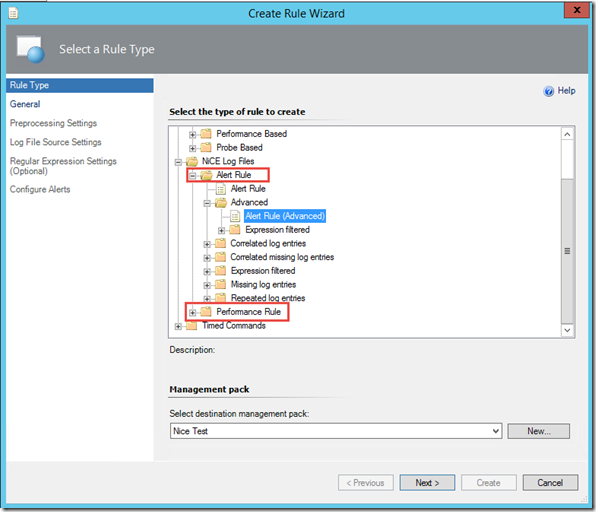
Unfortunately, we cannot build our rules 100% from the OpsMgr operations console. The NiCE Log File MP does not provide any event collection rules in the UI. There are only alert rules and performance collection rules to choose from:
This is OK, because as I explained before, rules consists of 3 types of modules. An alert rule generated in this UI would have 2 member modules:
- Data source module (called ‘NiCE.LogFile.Library.Advanced.Filtered.LogFileProvider.DS’) to collect the log entries and process them using the RegEx provided by you.
- Write Action Module (called ‘System.Health.GenerateAlert’): Generate alerts based on the data passed from the data source module.
What we can do is to take the same data source module from such an Alert rule (and it’s configuration), then build our own rule with our condition detection module (called ‘System.Event.GenericDataMapper’) to map the data into Windows Event Log format, and use any of these 3 write action module to store the data:
- Write to Ops DB: ‘Microsoft.SystemCenter.CollectEvent’
- Write to DW DB: ‘Microsoft.SystemCenter.DataWarehouse.PublishEventData’
- Write to OMS (OpInsights): ‘Microsoft.SystemCenter.CollectCloudGenericEvent’
However, to go one step further, since there are so many input parameters we need to specify for the Data Source module, and I want to hide the complexity for the users (your System Center administrators), I have created my own data source modules, and “wrapped” the NiCE data source module ‘NiCE.LogFile.Library.Advanced.Filtered.LogFileProvider.DS’ inside my own data source module. By doing so, I am able to hardcode some common fields that are same among all the rules we are going to create (i.e. the regular expression, etc.). Because the regular expression for ConfigMgr client logs and server logs are different, I have created 2 generic data source modules, one for each type of log – that you can use when creating your event collection rules.
When creating your own event collecting rules, you will only need to provide the following information:
- IntervalSeconds: How often should the NiCE data source to scan the particular log
- ComputerName: the name of the computer of where the logs is located. – This could be a property of the target class (or a class in the hosting chain).
- EventID: to specify an event ID for the processed log entries (as we are formatting the log entries as Windows Event Log entries)
- Event Category: a numeric value. Please refer to the MSDN documentation for the possible value: https://msdn.microsoft.com/en-au/library/ee692955.aspx. It is OK to use the value 0 (to ignore).
- Event Level: a numeric value. Please refer to the MSDN documentation for the possible value: https://msdn.microsoft.com/en-au/library/ee692955.aspx.
- LogDirectory: the directory of where the log file is located (i.e. C:\Windows\CCM\Logs)
- FileName: the name of the log file (i.e. execmgr.log)
So What am I Offering?
I’m offering 3 management pack files to get you started:
ConfigMgr.Log.Collection.Library (ConfigMgr Logs Collection Library Management Pack)
This sealed management pack provides the 2 data source modules that I’ve just mentioned:
- ConfigMgr.Log.Collection.Library.ConfigMgr.Client.Log.DS (Display Name: ‘Collect ConfigMgr 2012 Client Logs Data Source’)
- ConfigMgr.Log.Collection.Library.ConfigMgr.Server.Log.DS (Display Name: ‘Collect ConfigMgr 2012 Server Logs Data Source’)
When you create your own management pack where your collection rules are going to be stored, you will need to reference this MP and use the appropriate data source module.
ConfigMgr.Log.Collection.Dir.Discovery (ConfigMgr Log Collection ConfigMgr Site Server Log Directory Discovery)
This sealed management pack is optional, you do not have to use it.
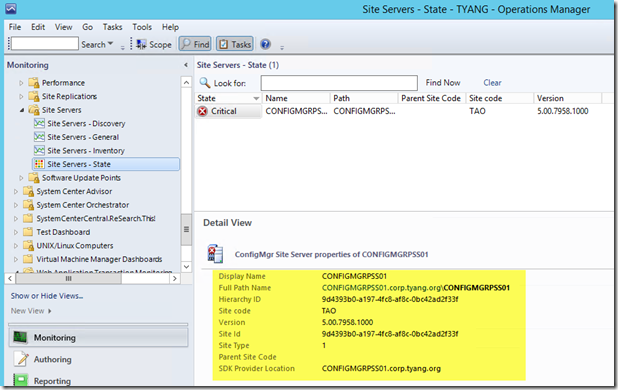
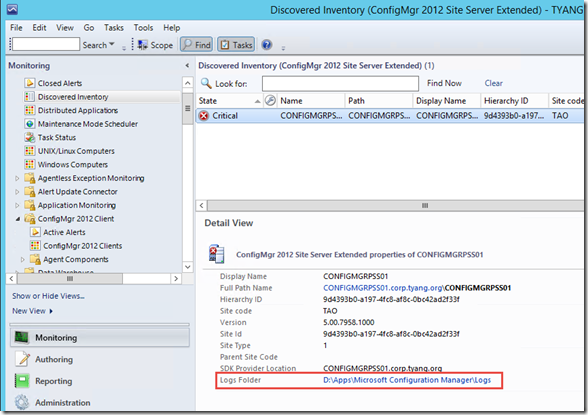
As I mentioned earlier, you will need to specify the log directory when creating the rule. The problem with this is, when you are creating a rule for a ConfigMgr server log file, it’s probably not ideal if you have to specify a static value because in a large environment where there are multiple ConfigMgr sites, the ConfigMgr install directory on each site server could be different. Unfortunately, the ConfigMgr 2012 management pack from Microsoft does not define and discovery the install folder or log folder as a property of the site server:
To demonstrate how we can overcome this problem, I have created this management pack. In this management pack, I have defined a new class called “ConfigMgr 2012 Site Server Extended”, it is based on the existing class defined from the Microsoft ConfigMgr 2012 MP. I have defined and discovered an additional property called “Log Folder”:
By doing so, we can variablise the “LogDirectory” parameter when creating the rules by passing the value of this property to the rule (I’ll demonstrate later).
Again, as I mentioned earlier, this MP is optional, you do not have to use it. When creating the rule, you can hardcode the “LogDirectory’’ parameter using a most common value in your environment, and using overrides to change this parameter for any servers that have different log directories.
ConfigMgr Logs Collection Demo Management Pack (ConfigMgr.Log.Collection.Demo)
In this unsealed demo management pack, I have created 2 event collection rules:
Collect ConfigMgr Site Server Wsyncmgr.Log to OpsMgr Operational DB Data Warehouse DB and OMS rule
This rule is targeting the “ConfigMgr 2012 Site Server Extended” class defined in the ‘ConfigMgr Log Collection ConfigMgr Site Server Log Directory Discovery’ MP, and collects Wsyncmgr.Log to all 3 destinations (Operational DB, Data Warehouse DB, and OMS).
Collect ConfigMgr Client ContentTransferManager.Log to OpsMgr Data Warehouse and OMS rule
This rule targets the “System Center ConfigMgr 2012 Client” class which is defined in the ConfigMgr 2012 (R2) Client Management Pack Version 1.2.0.0 (which is also developed by myself).
This rule collects the ContentTransferManager.log only to Data Warehouse DB and OMS.
**Note: **I’m targeting this class instead of the ConfigMgr client class defined in the Microsoft ConfigMgr 2012 MP because my MP defined and discovered the log location already. When you are writing your own rule for ConfigMgr clients, you don’t have target this class, as most of the clients should have the logs located at C:\Windows\CCM\Logs folder (except on ConfigMgr servers).
Note: There are few other good example on how to write event collection rules for OMS, you may also find these articles useful:
-
Azure OpInsights: Collecting Text Log Files with a custom PowerShell Script – By Wei Ho Lim
-
Collecting text log files to Azure Operational Insights using System Center Operations Manager – By Daniele Muscetta
What Do I get in OMS?
After you’ve created your collection rules and imported into your OpsMgr management group, within few minutes, the management packs would have reached the agents, started processing the logs, and send the data back to OpsMgr. OpsMgr would then send the data to OMS. It will take another few minutes for OMS to process the data before the data becomes searchable in OMS.
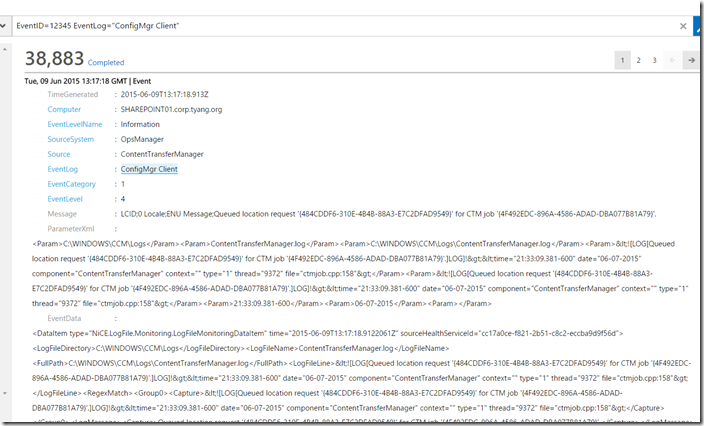
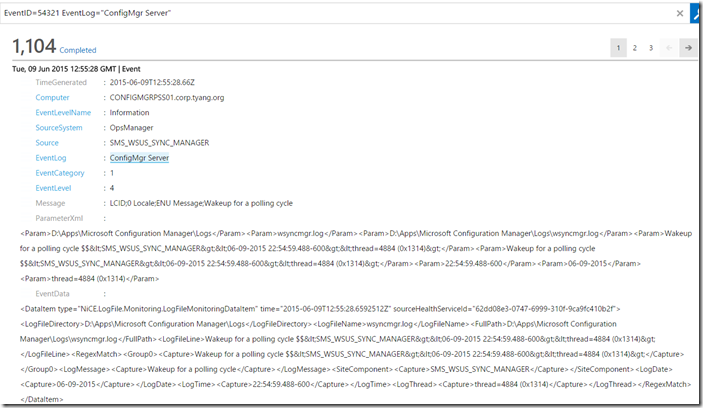
You will then be able to search the events:
Client Log Example:
Server Log Example:
As you can see, each field identified by the Regular Expression in NiCE data source module are structured in different parameters in the OMS log entry. You can also perform more complex searches. Please refer to the articles listed below for more details:
By Daniele Muscetta:
-
Azure Operational Insights Search How To: Part I - How to filter big data
-
Azure Operational Insights Search How To: Part IV – Introducing the MEASURE command
-
Azure Operational Insights Search How To: Part VII – Measure Sum() and Where command
Official documentation:
Download MP
You may download all 3 management packs from TY Consulting’s web site: http://www.tyconsulting.com.au/downloads/
What’s Next?
I understand writing management packs is not a task for everyone, currently, you will need to write your own MP to capture the log files of your choice. I am working on an automated solution. I am getting very close in releasing the OpsMgrExtended PowerShell / SMA module that I’ve been working since August last year. In this module, I will provide a way to automate OpsMgr rule creation using PowerShell. I will write a follow-up post after the release of OpsMgrExtended module to go through how to use PowerShell to create these ConfigMgr log collection rules. So, please stay tuned ![]()
**Note: **I’d like to warn everyone who’s going to implement this solution: Please do not leave these rules enabled by default when you’ve just created it. You need to have a better understanding on how much data is sending to OMS as there is a cost associated in how much data is sending to it, as well as the impact to your link to the Internet. So please make them disabled by default, start with a smaller group.
Lastly, I’d like to thank NiCE for producing such a good MP, and making it free to the community. ![]()
Leave a comment