OpsLogix VMware Management Pack Quick Overview
Recently, I have had chance to evaluate the OpsLogix VMware management pack. In this post, I will discuss my experience with this MP so far.
Setup and Configuration
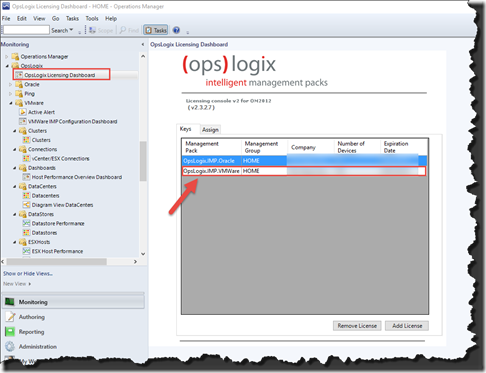
Once the MP files are imported , you will be able to import the license from the licensing dashboard in the monitoring pane under the OpsLogix folder.
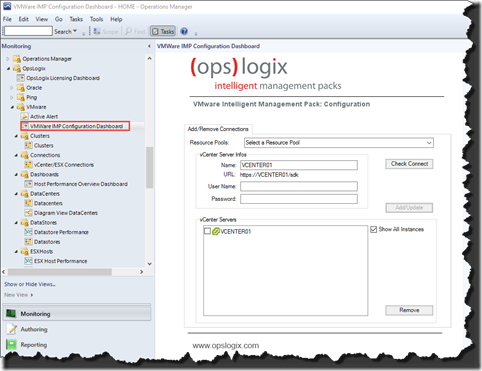
Once the license is imported, you can manually add the VMware vCenter server from the “VMWare IMP COnfiguration dashboard” located under OpsLogix\VMware folder:
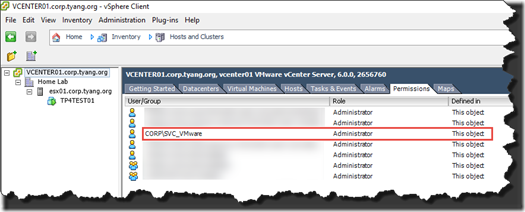
I have create a service account in AD and give it admin rights in vCenter. I used this account to connect to vCenter on this dashboard.
Note: Please do not use an account with administrative privilege in your production environment. a normal user with top level read-only access will suffice.
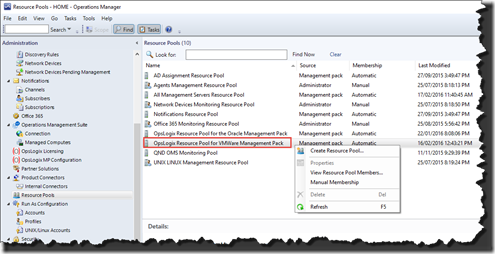
The OpsLogix VMware MP also has defined a resource pool that you can use for monitoring vCenter:
By default, the resource pool membership is set Automatic (which means all management servers are a member of). you can change it to Manual membership and hand pick the management servers you want to be a member of this resource pool.
Alternatively, you can also pick another existing resource pool (or even create your own) in the OpsLogix VMware configuration dashboard. You can also use resource pools containing OpsMgr gateway servers to monitor your VMware environment.
Discovered Objects
This MP discovers and monitors the following components:
- vCenter servers
- Datacenters
- Clusters
- Datastores
- ESX hosts
- Virtual Machines
- VM Networks
- Various hardware components
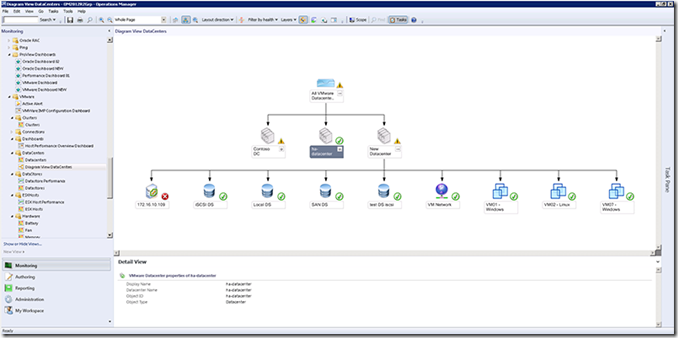
Here’s the sample diagram view from my lab environment:
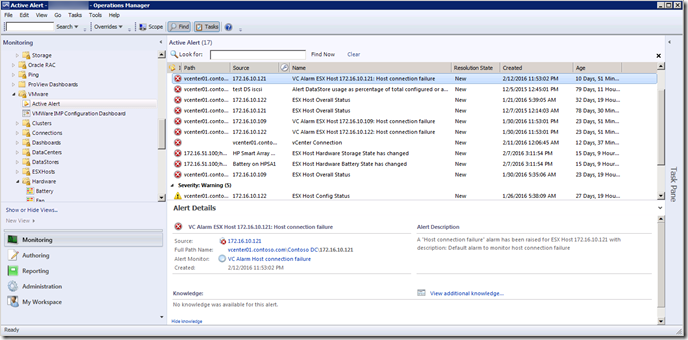
The MP ships with a top level Alert view for all alerts generated by the MP:
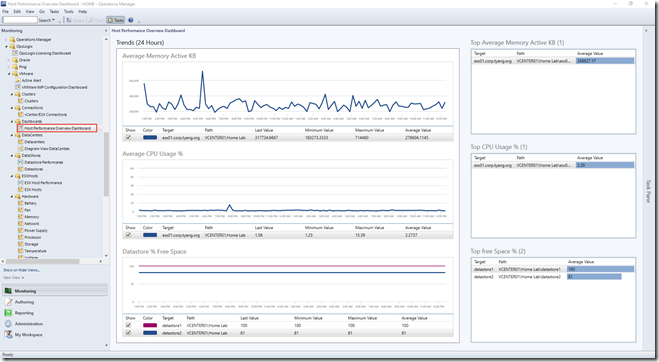
The MP collects data and queries the health state of the VMware components via the vCenter Managed Object Browser (MOB). I was impressed about how many performance counters are being collected by the MP. It also comes with a performance dashboard which you can view from the OpsMgr console:
I have been asked many times before that what exactly does this MP monitor / collect? To answer the question, I’ve used MPViewer and exported all the monitoring MPs to Excel and make this SpreadSheet that contains all the rules and unit monitors.
This MP does not require any additional servers to monitor the VMware infrastructure as it leverages a resource pool to query vCenter. In my lab environment, since I have installed vCenter server on a Windows server, I also installed the OpsMgr agent on the vCenter server, so the server itself is monitored by OpsMgr.
Hardware Monitoring
As mentioned previously, this MP also monitors the hardware components in your VMware environments. In particular, the following components are discovered and monitored:
- Battery
- Fan
- Memory
- Network cards
- Power Supply
- Processor
- Storage
- Temperature
- Voltage
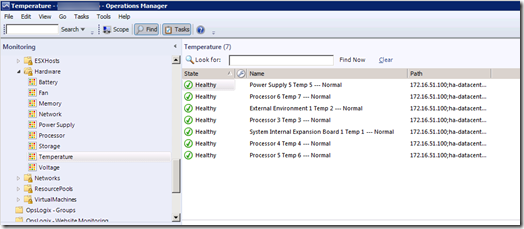
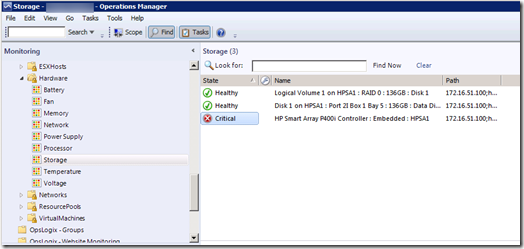
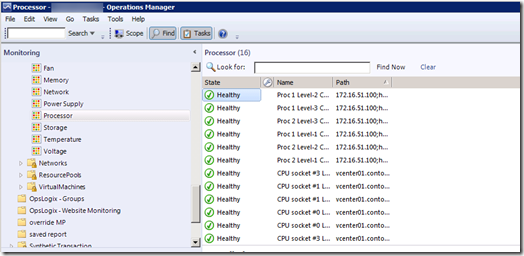
This covers all the essential fabric components (Compute, Network and Storage), as well as the other hardware components such as PSU, battery, and physical environments such as temperature and voltage. the screenshots below are some sample state views taken from a demo environment:
Temperature
Storage:
Processors:
Reporting
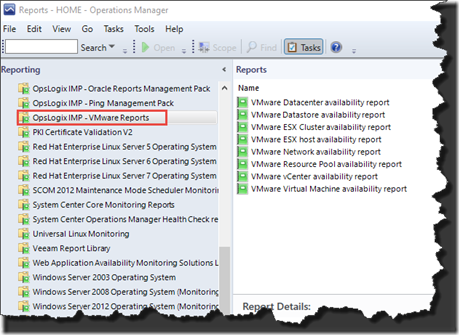
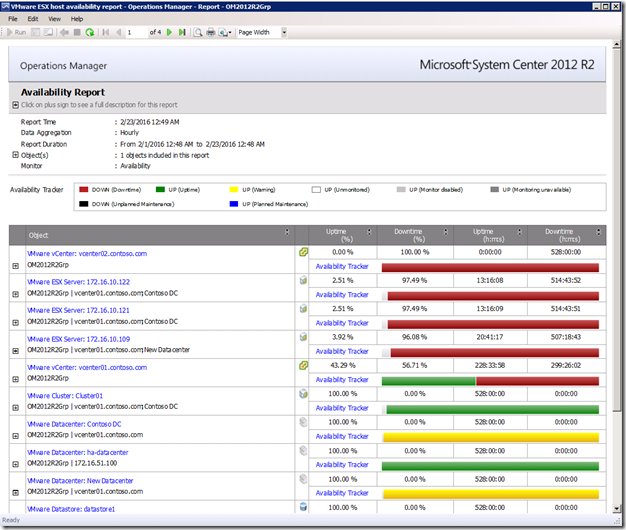
The reporting MP provides several availability reports for different VMware components:
i.e. ESX host availability report:
I’ve created a sample ESX host availability report, you can download it from HERE.
Note: all the reports shipped in this MP are linked reports, So if they don’t meet your requirements, you can always use other existing reports in your management group (i.e. the performance reports from Microsoft Generic Report Library).
Squared Up Dashboard
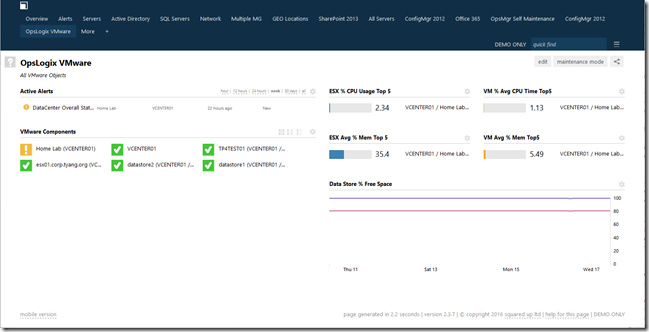
I have created a Squared Up dashboard for this the OpsLogix VMware MP.
If you are also Squared Up in your OpsMgr environment, you can download this dashboard and import this dashboard from Squared Up’s community site: https://community.squaredup.com/browse/download-info/opslogix-vmware/
Summary
If you’d like to know more about this MP, you can find the datasheet here: http://www.opslogix.com/wp-content/uploads/2014/08/VMware-MP-Datasheet-2016.pdf and the whitepaper here: http://www.opslogix.com/wp-content/uploads/2016/01/VMware-MP-White-Paper-2016.pdf
Leave a comment