Creating Azure Monitor Alerts using Azure Log Analytics Query Language Based On Azure Automation Runbook Job Output
Well, this post has such a long title – but I’ve tried my best. It is based on an idea I had – We all have many “Health Check” PowerShell scripts in our collections, why not use them in OMS without too much modification and generate meaningful alerts based on the outputs of these scripts? I have been meaning to write this post for at least 4 months, I finally found some spare time this weekend so I can work on this.
In the past, when I was still working on System Center Operations Manager, I always get requests from various support teams like “Could you write a monitor in SCOM to monitor xxx? I’ve already got a script, all you need is to add it into a Management Pack.” Well, it may sound pretty easy, but in most cases, these tasks are not as straight forward as you may think. In order to create a monitor or a rule in SCOM, you will need to define the monitoring class, health rollup model, object discoveries to begin with, then when you have a script, you will need to understand how to use property bags, how to leverage cook down within the script, where do you get input parameters from, and then it comes to the actual alert (and maybe alert suppression too), then how do people want to get notified? Furthermore, based on my experience, these scripts I got from the support teams generally do more than one things. so most of the time, I ended up re-writing the scripts for the Management Packs. As you can see, this is a very complicated task, not something you’d expect an average System Admin could do. I personally believe the complexity of SCOM management packs, and the lack of available training / knowledge in the market has really limited the adoption of SCOM (to a degree).
So, wouldn’t it be nice if we can leverage an existing script you wrote or found on the Internet, and turn it into something that you can actually use for alerting in production environments? This was doable in OMS, but still a bit complicated before the update of the Azure Log Analytics search language. Before the update, in v1 of the search language, in order to retrieve structured information from the search result, you have to either use the Log Analytics HTTP injection API to inject structured logs into Log Analytics, or create custom logs to create additional fields after the logs have been injected. This is still too complicated, and can be very time consuming. I don’t think many of us would go down this path too often.
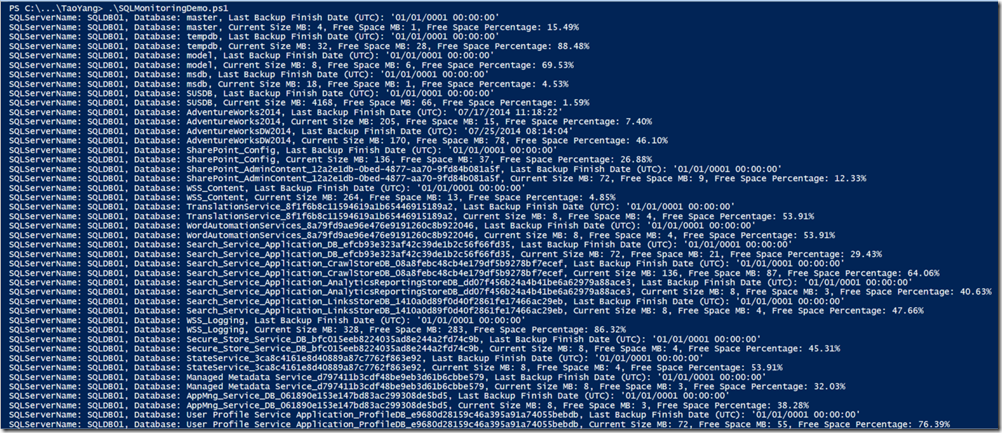
Luckily, with the new v2 of the Log Analytics search language (a.k.a Kusto, which is also used in Azure Application Insights), we are able to extract information from a log field on the fly using the parse() operator. The parse() operator supports simple expressions or regex so you can pretty much do anything when extracting required information from any given fields. To demonstrate how I can quickly setup alerts from a very basic PowerShell script, I will use a demo script (scroll down to the bottom of this post to view the source code) that checks the last backup date and free space of all SQL databases on a group of SQL servers. The SQL servers are located On-prem (in my home lab), and I am going to use Azure Automation to run this script (as a PowerShell runbook) on a Hybrid Worker computer also located in my home lab. The script simply writes the result in standard output (stdout) using Write-Output cmdlet. it looks like this (when running on my desktop):
As you can see, the script produces 2 lines for each database. The first line lists the SQL server name, database name, and the last backup finished date, and the second line lists the server name, database name, current size, free space size and free space % in a human readable format.
In order to use this script as the alert source, we need to make some once-off initial configurations (assuming you already have an Azure Log Analytics workspace and an Azure Automation account):
- Link the Azure Automation Account to the Log Analytics workspace so you can use the Hybrid workers to run runbooks on-prem
- Install at least one Hybrid Worker VM in your environment (https://docs.microsoft.com/en-us/azure/automation/automation-hybrid-runbook-worker)
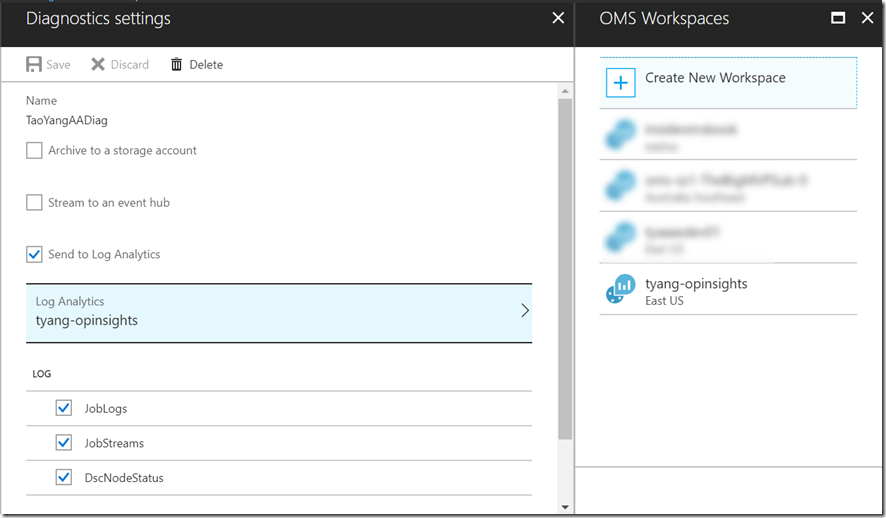
- Configure the Diagnostics settings for you Azure Automation account and forward logs and metrics to the Log Analytics workspace (https://docs.microsoft.com/en-us/azure/automation/automation-manage-send-joblogs-log-analytics). btw, this instruction is too complicated. you can simply go to Azure Monitors in the Azure Portal, then go to the “Diagnostics settings” blade, find your automation account, and configure it to send everything to your Log Analytics workspace
Once these steps are completed, I created a runbook based on my existing PowerShell script. Since I need to store the list of SQL server names and the credential to connect to my SQL instances (in this case, i’m using my default sa account), I have created a variable in the automation account to store the SQL server names, and a credential object to store the “sa” credential.
Note: This is only for demo purposes, you many use a different strategy to store all your sever names in your production environments (i.e. Azure table storage, your CMDB, or create computer groups in Log Analytics, and query Log Analytics for the members in the group, etc.)
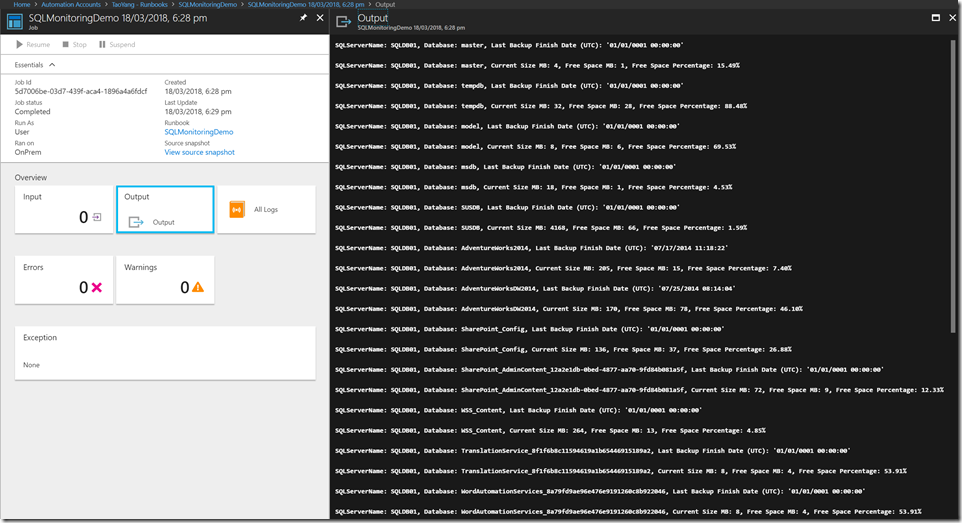
Since I need this runbook to run on a regular basis, I created a schedule in Automation account to run this runbook. When the runbook is executed, all the Write-Output messages gets written to the job stream, and subsequently got logged into Log Analytics. i.e. Here’s the job output in Azure Automation:
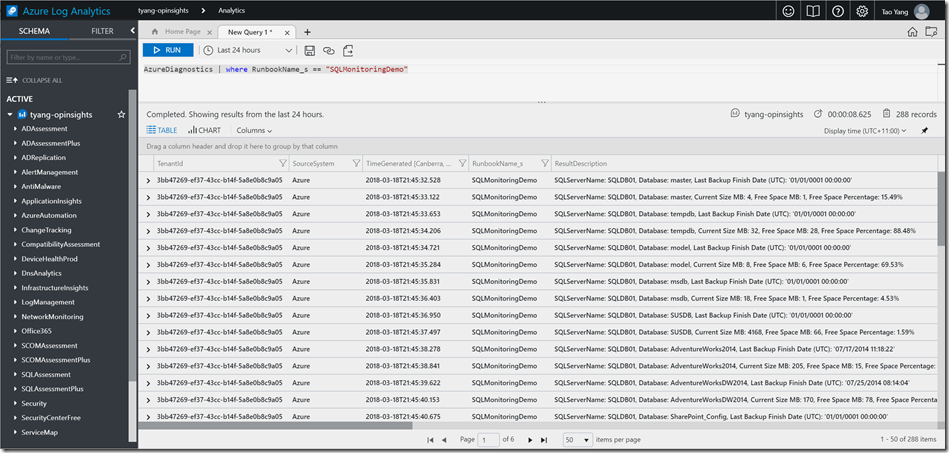
and also in Log Analytics (you’ll need to wait few minutes after the runbook job):
Once we can confirm these PowerShell script outputs got landed in Log Analytics, we can easily create Azure Monitor alerts based on custom search queries. In this case, I am creating two (2) separate alerts, one for the last DB backup date is more than 2 days old (The DB hasn’t been backed up for more than 2 days), and another one for the % free space within a database is less than 20%. Here are the search queries I used for these 2 alerts:
DB Backup Alerts:
AzureDiagnostics
| where RunbookName_s == "SQLMonitoringDemo"
| where ResultDescription contains "Backup"
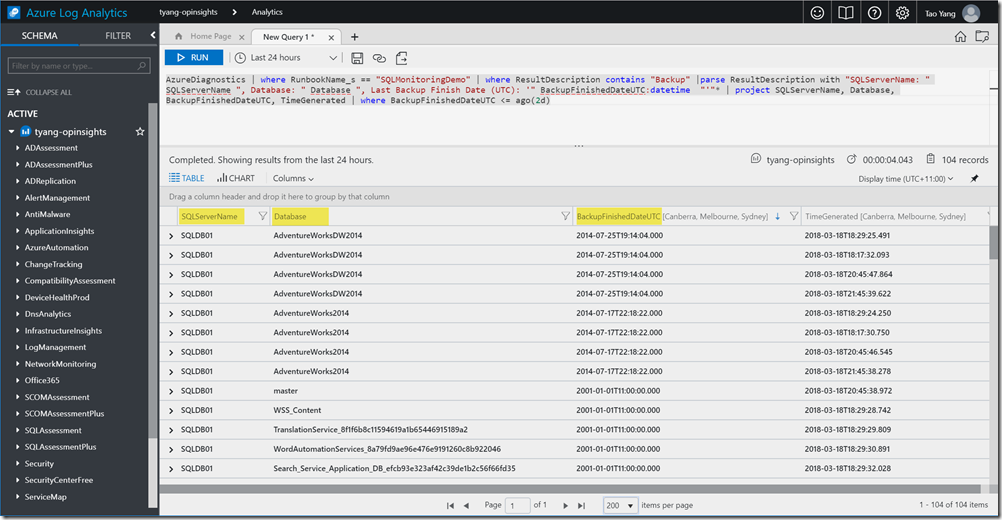
| parse ResultDescription with "SQLServerName: " SQLServerName ", Database: " Database ", Last Backup Finish Date (UTC): '" BackupFinishedDateUTC:datetime  "'"*
| project SQLServerName, Database, BackupFinishedDateUTC, TimeGenerated
| where BackupFinishedDateUTC <= ago(2d)
DB Free Space Alerts:
AzureDiagnostics
| where RunbookName_s == "SQLMonitoringDemo"
| where ResultDescription contains "Free Space"
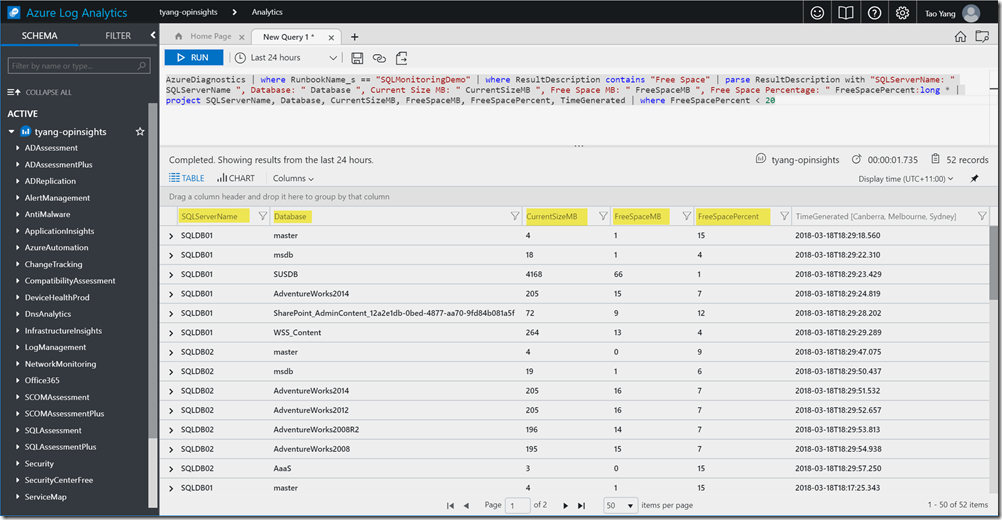
| parse ResultDescription with "SQLServerName: " SQLServerName ", Database: " Database ", Current Size MB: " CurrentSizeMB ", Free Space MB: " FreeSpaceMB ", Free Space Percentage: " FreeSpacePercent:long *
| project SQLServerName, Database, CurrentSizeMB, FreeSpaceMB, FreeSpacePercent, TimeGenerated
| where FreeSpacePercent < 20
As you can see, I’m extracting the SQL Server name, DB name, Last backup date, current size, free space size and free space % from the ResultDescription field using the parse() operator. I’m also converting the FreeSpacePercent field to long and backup finished date to datetime type. The ResultDescription field is where the runbook jobstream data is stored. If I manually run these two search queries in the Advanced Analytics portal, I can see these custom fields got created in the search result on the fly:
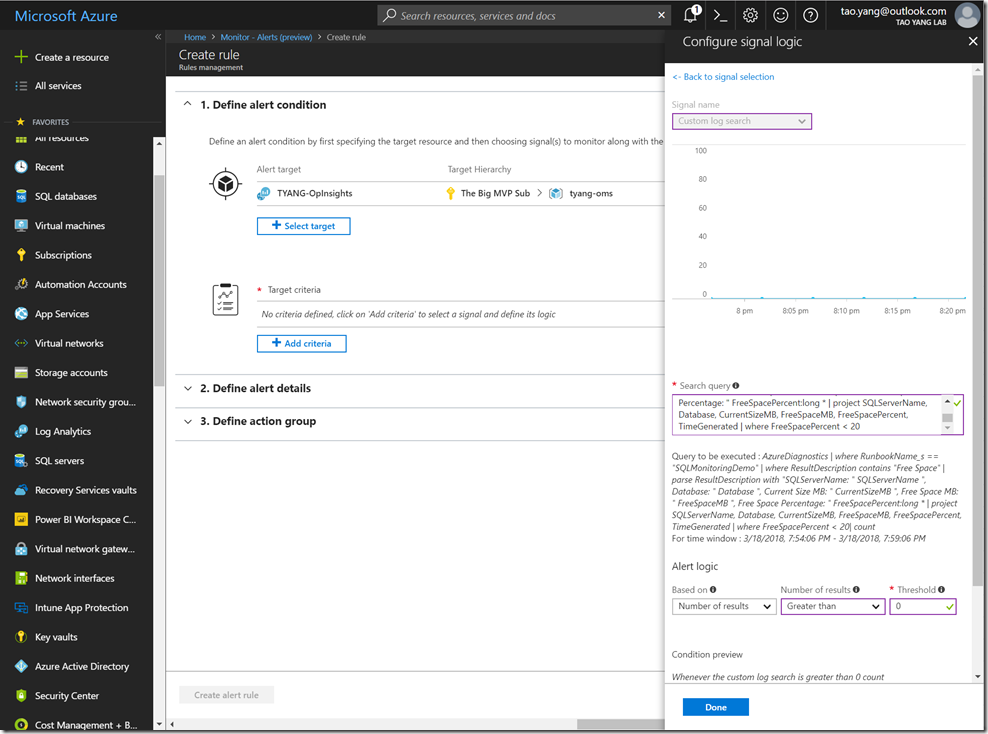
To create the alerts, in Azure Portal, go to Azure Monitor, and create new alert rules in the Alerts (preview) blade:
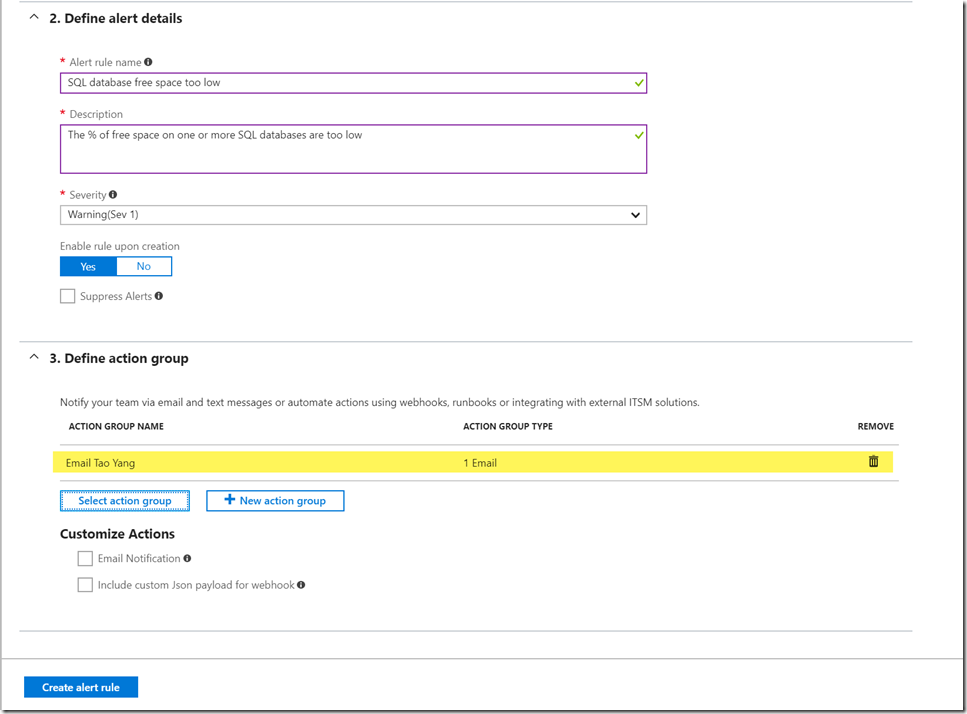
I also created an Action Group that contains my email address for the alert rules, so when the alerts are fired, I will get notified via email. there are other delivery options within Action Groups (i.e. SMS, voice calls, push notification to the Azure mobile app, webhooks, send to ITSM systems, Azure Automation runbooks, etc.), make sure you check them out.
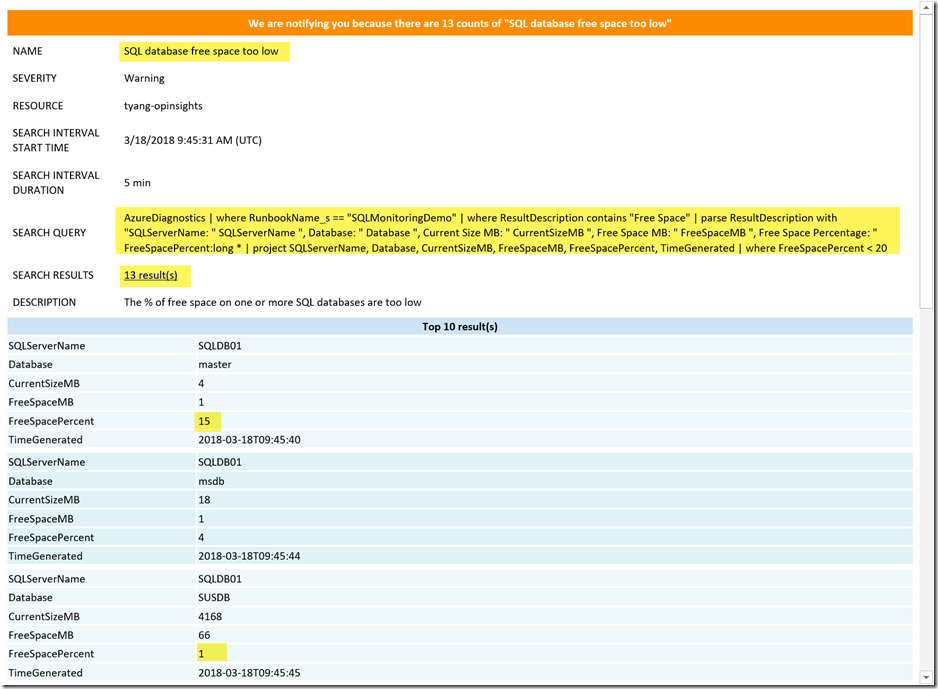
Needless to say, after a while, I started getting alert email notifications:
If you want to learn more about the capability of the Log Analytics query language, make sure you visit the documentation site here: https://docs.loganalytics.io/index and the demo workspace here: https://portal.loganalytics.io/demo#/discover/home
Lastly, as promised, here’s the demo runbook I have used in this blog post:
 <#
====================================================================================================
AUTHOR:  Tao Yang
DATE:    18/03/2018
Version: 1.0
Comment: demo Azure Automation runbook for creating Azure alerts using Log Analytics search queries
====================================================================================================
#>
#region functions
Function Invoke-SQLQuery
{
  [OutputType([System.Collections.ArrayList])]
  [OutputType([int])]
  [CmdletBinding()]
  PARAM (
    [Parameter(Mandatory=$true,HelpMessage='Please enter the SQL Server name')][Alias('SQL','Server','s')][String]$SQLServer,
    [Parameter(Mandatory=$false,HelpMessage='Please enter the SQL Instance name')][Alias('Instance','i')][String]$SQLInstance,
    [Parameter(Mandatory=$false,HelpMessage='Please enter the TCP Port number for the SQL Instance')][Alias('port')][int]$SQLPort,
    [Parameter(Mandatory=$true,HelpMessage='Please enter the SQL Database name')][Alias('d')][String]$Database,
    [Parameter(Mandatory = $false)][Alias('e')][Boolean]$Encrypt = $false,
    [Parameter(Mandatory = $false)][Alias('trust')][Boolean]$TrustServerCertificate = $false,
    [Parameter(Mandatory = $true)][Alias('q')][String]$Query,
    [Parameter(Mandatory = $false)][Alias('type')][ValidateSet('Query','NonQuery')][String]$CommandType='Query',
    [Parameter(Mandatory = $true,HelpMessage='Please specify the SQL credential')][Alias('cred')][PSCredential][System.Management.Automation.Credential()]$Credential,
    [Parameter(Mandatory = $false)][Alias('timeout', 't')][int]$SQLQueryTimeout = 600
  )
  if ($PSBoundParameters.ContainsKey('SQLInstance'))
  {
    $SQLServerConn = "$SQLServer`\$SQLInstance"
  }
  else
  {
    $SQLServerConn = $SQLServer
  }

  if ($PSBoundParameters.ContainsKey('SQLPort'))
  {
    $SQLServerConn = "$SQLServerConn`,$SQLPort"
  }

  $ConnectionString = "Server`=$SQLServerConn; Database=$Database;Encrypt=$Encrypt;TrustServerCertificate=$TrustServerCertificate;"
  $SQLCon = New-Object -TypeName System.Data.SqlClient.SqlConnection
  $SQLCon.ConnectionString = $ConnectionString
  $Credential.Password.MakeReadOnly()
  $SQLCred = New-Object -TypeName System.Data.SqlClient.SqlCredential -ArgumentList ($Credential.UserName, $Credential.Password)
  Write-Verbose -Message "Adding credential '$($Credential.UserName)' to the SQL connection object."
  $SQLCon.Credential = $SQLCred
  $SQLCon.Open()

  #execute SQL query
  $sqlCmd = $SQLCon.CreateCommand()
  $sqlCmd.CommandTimeout = $SQLQueryTimeout
  $sqlCmd.CommandText = $Query

  Switch ($CommandType)
  {

    'Query' {
      $SqlAdapter = New-Object -TypeName System.Data.SqlClient.SqlDataAdapter
      $SqlAdapter.SelectCommand = $sqlCmd
      $DataSet = New-Object -TypeName System.Data.DataSet
      [void]$SqlAdapter.Fill($DataSet)
      #Process result
      $arrReturnedData = New-Object -TypeName System.Collections.ArrayList
      Foreach ($set in $DataSet.Tables[0])
      {
        $objDS = New-Object -TypeName psobject
        Foreach ($objProperty in (Get-Member -InputObject $set -MemberType Property))
        {
          $PropertyName = $objProperty.Name
          Add-Member -InputObject $objDS -MemberType NoteProperty -Name $PropertyName -Value $set.$PropertyName
        }
        [void]$arrReturnedData.Add($objDS)
      }
      #Return the array list
      $ReturnedData = $arrReturnedData
    }
    Default {
      try {
        $NumberOfRowsAffected = $sqlCmd.ExecuteNonQuery()
      } catch {
        Write-Error $_.Exception.InnerException
      }
      #return number of rows affected (numeric value)
      $ReturnedData = $NumberOfRowsAffected
    }
  }
  if ($SQLCon.State -ieq 'open')
  {
    $SQLCon.Close()
  }

  #Process result
  if ($CommandType -ieq 'query')
  {
    #Return the array list
    Write-Verbose -Message "Number of rows returned: $($ReturnedData.count)"
    ,$ReturnedData
  } else {
    Write-Verbose -Message "Number of rows affected: $ReturnedData"
    $ReturnedData
  }
}
#endregion

#region main
#SQL Queries
#SQL DB Data free space
$SQLDBFreeSpaceQuery = "SELECT DB_NAME() AS DbName, name AS FileName, size/128.0 AS CurrentSizeMB, size/128.0 - CAST(FILEPROPERTY(name, 'SpaceUsed') AS INT)/128.0 AS FreeSpaceMB FROM sys.database_files where type_desc = 'ROWS'"

#Get All Databases
$GetDBQuery = "SELECT name FROM master.dbo.sysdatabases"

#Database last backup
$DBLastBckpQueryTemplate = "SELECT top 1 * FROM dbo.backupset where database_name = '{0}' order by backup_start_date desc"

#GEt list of SQL Servers
$arrSQLServers = (Get-AutomationVariable SQLServers).split(';')

#Get default SQL SA credential
$SQLSACredential = Get-AutomationPSCredential SQL-SA

Foreach ($SQLServer in $arrSQLServers)
{
  #Get all databases
  $AllDBs = (Invoke-SQLQuery -SQLServer $SQLServer -Database 'master' -Credential $SQLSACredential -Query $GetDBQuery).name
  Foreach ($DB in $AllDBs)
  {
    Write-Verbose "CHecking $DB on $SQLServer"
    #Get last backup date
    $DBLastBckpQuery = [string]::Format($DBLastBckpQueryTemplate, $DB)
    $LastBackupSet = Invoke-SQLQuery -SQLServer $SQLServer -Database 'msdb' -Credential $SQLSACredential -Query $DBLastBckpQuery
    If ($LastBackupSet.count -gt 0)
    {
      $UTCOffSetMinute = $LastBackupSet[0].time_zone * 15
      $BackupFinishedDate = $LastBackupSet[0].backup_finish_date
      $LastBackupUTCTime = $BackupFinishedDate.AddMinutes($UTCOffSetMinute)
    } else {
      $LastBackupUTCTime = get-date 0
    }
    Write-Output "SQLServerName: $SQLServer, Database: $DB, Last Backup Finish Date (UTC): '$LastBackupUTCTime'"

    #Check DB free space
    $DBFreeSpaceQueryResult = Invoke-SQLQuery -SQLServer $SQLServer -Database $DB -Credential $SQLSACredential -Query $SQLDBFreeSpaceQuery
    $DBFreeSpacePercent = ($DBFreeSpaceQueryResult[0].FreeSpaceMB / $DBFreeSpaceQueryResult[0].CurrentSizeMB).tostring("P")
    $CurrentSizeMB = [math]::Round($DBFreeSpaceQueryResult[0].CurrentSizeMB)
    $FreeSpaceMB = [math]::Round($DBFreeSpaceQueryResult[0].FreeSpaceMB)
    Write-Output "SQLServerName: $SQLServer, Database: $DB, Current Size MB: $CurrentSizeMB, Free Space MB: $FreeSpaceMB, Free Space Percentage: $DBFreeSpacePercent"
  }
}
#endregion

Leave a comment