How to Create a Squared Up Visio Dashboard for an Existing Distributed Application
Background
OK, it has been over a month since my last blog post. Not that I’ve been lazy, I’ve actually been crazily busy. As you may know, I’ve started working for Squared Up after Ignite. So, this is another blog about Squared Up – this time, I’ll touch base on the Visio dashboard.
If you haven’t heard or played with Squared Up’s Visio Dashboard plug-in, you can find a good demo by Squared Up’s founder, Richard Benwell in one of Microsoft Ingite’s SCOM Sessions here: https://www.youtube.com/watch?v=cUc2RSaoHtI
If you already have a Visio diagram for your application (that’s been monitored by OpsMgr), it is really quick and easy to import it into Squared Up as a dashboard (as Richard demonstrated in the Ignite session). However, what if you don’t have Visio diagrams for aparticular application you want to create dashboard for (i.e. an Off-The-Shelve application such as AD, ConfigMgr, etc.)? If this is the case, you can manually create the Visio diagram – and hopefully you are able to find the relevant stencils for your applications. But, this can take a lot of time. If you are like me, who really hate drawing Visio diagrams, you probably won’t enjoy this process too much.
In this post, I’ll show you how to quickly produce a Visio dashboard in Squared Up for an existing application that’s been monitored by SCOM. I’ll use the Windows Azure Pack Distributed Application from the community WAP management pack as an example (developed by Oskar Landman from Inovativ: http://www.systemcentercentral.com/windows-azure-pack-scom-management-pack/).
Walkthrough
01. In OpsMgr console, open the diagram view for the DA of your choice and export it to a Visio .vdx file:
Click OK if you get a message warning you there are too many objects included in this DA:
By default, the diagram view will only show the top level objects. However, you can keep drilling down the diagram, until you get a desired diagram (that you wish to display in Squared Up). In this demo, I will just use the diagram with top level objects:
As shown above, click the export button to export this diagram to a Visio diagram (.vdx) file.
02. Preparing the Visio diagram (.vsdx) from the .vdx file:
When you open the .vdx file, and zoom in, it looks exactly the same as the OpsMgr diagram view:
Firstly, you will need to remove the health state icons (the green ticks and red crosses in this case). A .vdx file is read-only in Visio, so after the icons have been removed, Save it as a .vsdx file. The .vsdx file looks like this now:
Now, we need to import SCOM monitoring objects data into this Visio diagram. Squared Up has written a good user guide on how to generate an Excel spreadsheet for the monitoring object information from Squared Up console. You can find this article here: http://support.squaredup.com/support/solutions/articles/207629-how-to-configure-a-visio-section-using-the-dashboard-designer
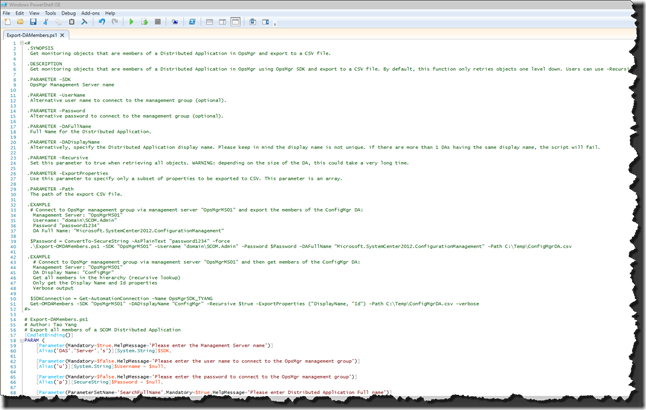
However, by using the Squared Up console as mentioned above, you have to manually lookup every single monitoring object that is displayed in the Visio diagram. This can be very time consuming if you have a lot of objects in your diagram. In order to simplify this process, I have created a PowerShell script called Export-DAMembers.ps1 to get the information for members of a Distributed Application, and export the data to a CSV file.
You can download this script from HERE.
Note: This script does not require the native OpsMgr PowerShell module to run, however, it does require the OpsMgr 2012 SDK assemblies. If you are running it on an OpsMgr management server, web console server, or a computer that has the operational console installed, you don’t need to do anything else, you can just run this script straightaway. But if you are running this script on a computer that does not meet any of these requirements, you will need to copy the 3 OpsMgr 2012 SDK DLLs to the same folder of where the script is located. these 3 DLLs are:
- Microsoft.EnterpriseManagement.Core.dll
- Microsoft.EnterpriseManagement.OperationsManager.dll
- Microsoft.EnterpriseManagement.Runtime.dll
You can find them on a management server, located at <OpsMgr install directory>\Server\SDK Binaries
I have included a help section for the script, as well as all the functions in the script, so I won’t go through how to use it here. you can simply open the script in a text editor and read it if you like:
In order to export the information we need for the Visio dashboard, we only need the Display Name and the Monitoring Object Id. I’m running the script with the following parameters:
.\Export-DAMembers.ps1 -SDK “<SCOM Management Server Name>” -DADisplayName “Windows Azure Pack” -ExportProperties (“DisplayName”, “Id”) -Path C:\Temp\DAExport1.csv –verbose
Note: As you can see, because I’m only going to display the top level objects in the dashboard, so I did not have to use recursive lookup, therefore, only 6 objects returned. If I run the script again with “-recursive $true” parameter, it will return all objects that are member of the DA (143 in total):
The total number matches the previous warning message in the OpsMgr diagram view:
Once the CSV is exported, open it in Excel:
In order for Squared Up to understand the data, we will need to change the title for both columns:
- Change DisplayName to ScomName
- Change Id to ScomId
Now, save it as an Excel Spreadsheet (.xlsx file).
We can now import the data from the Excel spreadsheet into the Visio diagram. The guide from Squared Up’s site has documented it very well, I won’t go through it again here.
After I’ve mapped the data for each object in the Visio diagram, it looks like this:
I’ve then hidden the data in Visio, exported it as a .SVG file, and produced a Visio dashboard in Squared Up using the SVG file. The final piece looks like this:
Which is very similar to the diagram view in OpsMgr console:
Conclusion
If you already have Squared Up in your environment, I hope you find this blog post useful. As I demonstrated, it is really easy to create a Squared Up dashboard for your existing Distributed Applications – and I’ve already done the hard work for you (creating the script for looking up monitoring object IDs).
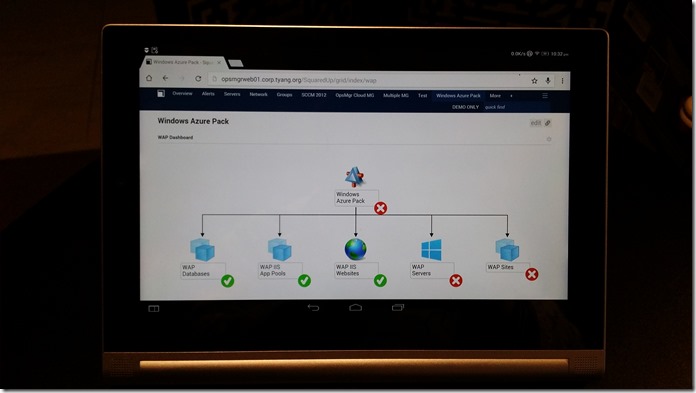
As we all know, Squared Up is based on HTML 5 and it’s cross platform, You can use it on browsers other than IE, as well as mobile devices such as an Android tablet. The picture below is my Lenovo Yoga Tab 2 Android tablet displaying this Squared Up WAP dashboard I’ve just created ![]()


Leave a comment