OpsMgr Performance Collection Rules for OMS Near Real-Time Performance Data Collection
Update: 09/09/2015: I found a small error in the demo MP provided at the end of this post, where one of the perf collection rules had an extra condition detection module (which prevents the real-time perf data to be sent to OMS). I have just updated the MP and the download link.
Introduction
Yesterday, the OMS product team has announced the availability of the Near-Real Time (NRT) Performance Data Collection in OMS. My buddy and fellow SCCDM MVP Stanislav Zhelyazkov has already wrote an article on his blog: Operations Management Suite – Performance Monitoring.
I won’t repeat what’s already been discussed in these 2 posts, but I’ll tackle it from the management pack authoring perspective, and sharing what I have discovered so far.
Note: If you haven’t read above mentioned 2 posts, I strongly recommend you to do so before continuing with this article.
Management Pack Under The Hood
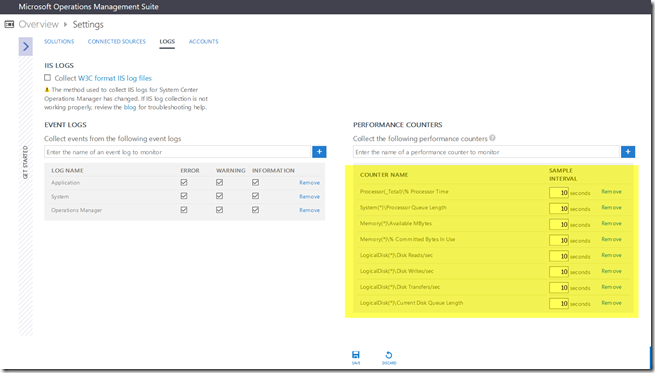
By default, OMS has 8 performance counters configured for near-real time perf collection. You can see them in the settings section of your workspace:
As explained in both the official blog post from the OMS product team as well as Stan’s blog, you can add additional perf counters on this page, and it will be pushed to the OpsMgr management groups that are connected to this OMS workspace. I am fairly certain, the sample interval range is between 10-1800 seconds (minimum 10 seconds, maximum 30 minutes).
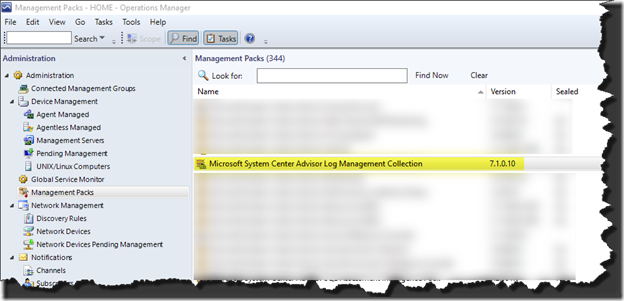
All the counters configured on this page are stored in an Unsealed management pack called “Microsoft System Center Advisor Log Management Collection” in your OpsMgr management group.
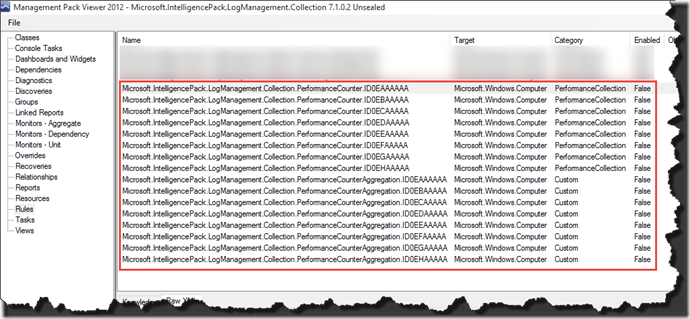
If you export this MP and open it using MPViewer, you will see there are 2 rules for each counter:
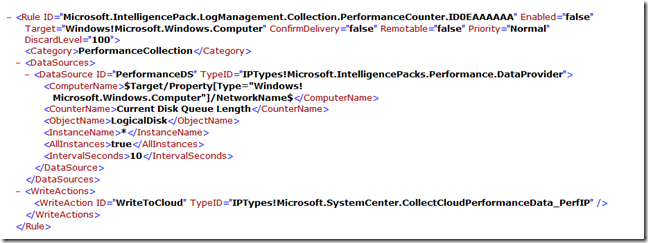
Microsoft.IntelligencePack.LogManagement.Collection.PerformanceCounter.xxxxxxxxxx:
These rules are collecting the raw real time perf data:
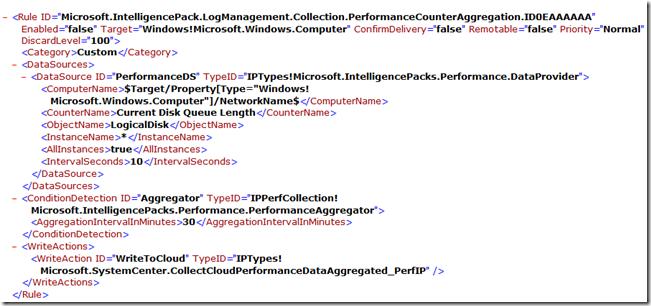
Microsoft.IntelligencePack.LogManagement.Collection.PerformanceCounterAggregation.xxxxxxxxxx:
As the name suggested, these rules are collecting the 30-minute aggregated data (As stated in the official blog post, the raw data retention is 14 days and the 30-minute aggregated data retention is same as your OMS data plan).
After Examining these 2 rules closely, we can see the following:
-
Both rules are disabled by default
-
Both rules are not remoteable (won’t work for agentless machines)
-
Both rules are targeting the Windows Computer class (Microsoft.Windows.Computer)
-
Both Rules are using the same data source module with same input parameters (Microsoft.IntelligencePacks.Performance.DataProvider). This configuration enables OpsMgr agents to leverage the Cookdown feature to reduce the computer resource consumed by these rules.
-
Comparing with the raw data collection rule, the aggregation data collection rule has an additional condition detection module (which is used for data aggregation) and the aggregated data is submitted to OMS via a different write-action module (Microsoft.SystemCenter.CollectCloudPerformanceDataAggregated_PerfIP).
-
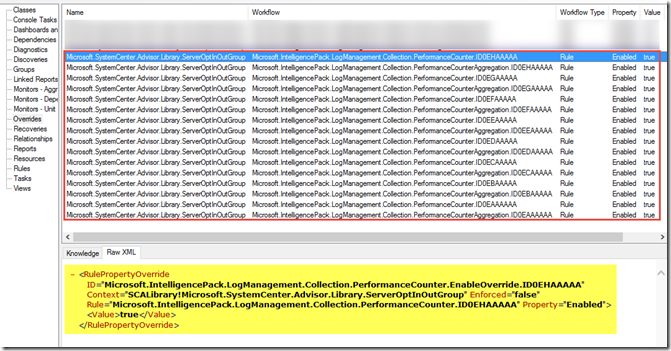
Since both rules are disabled by default, the MP also comes with overrides to enable these rules for the OMS managed computers:
Write Your own OMS Near-Real Time Perf Collection Rules
Now that we have discovered how are the near-real time perf data is collected in OpsMgr, I have spent some time today testing different rule configurations. Based on my own experience, my findings are:
01. Both raw data collection rule and aggregation data collection rule are required
Based on my testing, I found in order to submit near-real time perf data to OMS, I must create both raw data and aggregation data collection rules (as shown above). I tried with only one rule for the raw data, after few hours, I still couldn’t see the data in OMS. I then created another rule for the aggregation data, imported the updated MP in OpsMgr, after about 30 minutes, the data became visible from the search result.
02. Data source module “Microsoft.IntelligencePacks.Performance.DataProvider”
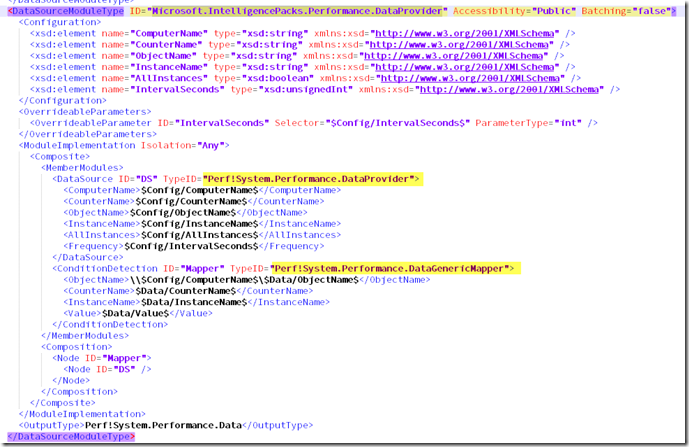
The rule must use the data source module “Microsoft.IntelligencePacks.Performance.DataProvider”, which is defined in management pack “Microsoft System Center Advisor Types Library” (Microsoft.IntelligencePacks.Types). This data source module consists of 2 member modules:
- Data Source: System.Performance.DataProvider
- Condition Detection: System.Performance.DataGenericMapper
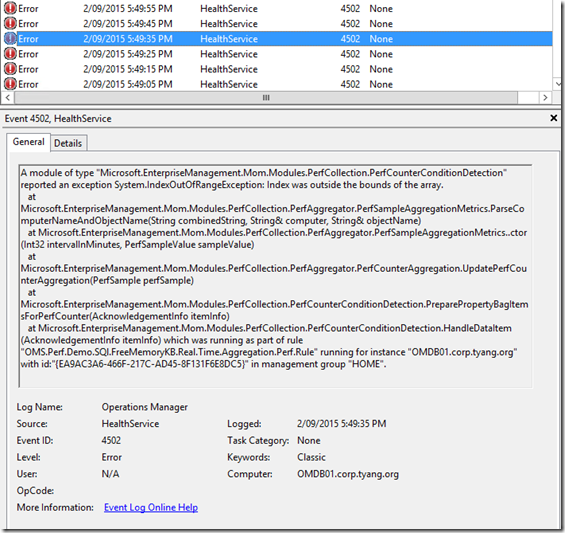
I have tried to use System.Performance.DataProvider module directly in both raw and aggregation data collection rules, unfortunately this configuration does not seem to work. additionally, many 4502 events were logged in the Operations Manager log on the OpsMgr agent computer indicating the configuration for the aggregation data collection rule is incorrect.
03. The Rule target must be Windows Computer class (Microsoft.Windows.Computer).
Initially I have written few rules targeting SQL DB Engine class, waited few hours and I could only see the 30-minute aggregated data in OMS (collected by the aggregation collection rules). The data insertion is every 30 minutes and the perf graph could not be displayed in OMS (showed “No Data”). When I changed the target for both rules from SQL DB Engine to Windows Computer class, the raw data started to appear.
Having said that, I have also tried Windows Server Computer class (Microsoft.Windows.Server.Computer). This class is derived from Windows Computer class. This configuration also worked. So in my opinion, it is fair to guess the target class must be Windows Computer class or class that’s based on Windows Computer class.
Demo Management Pack “OMS Performance Demo MP”
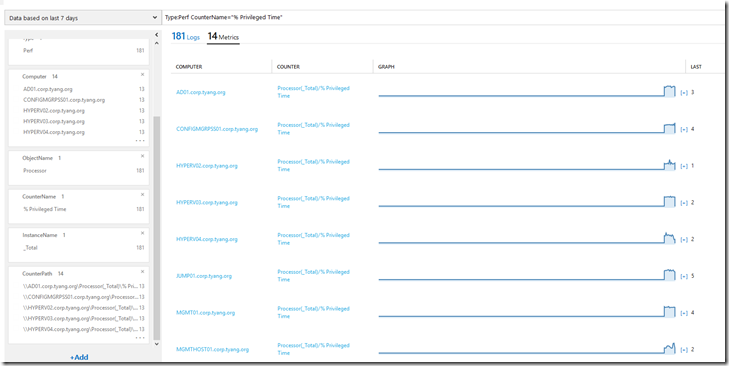
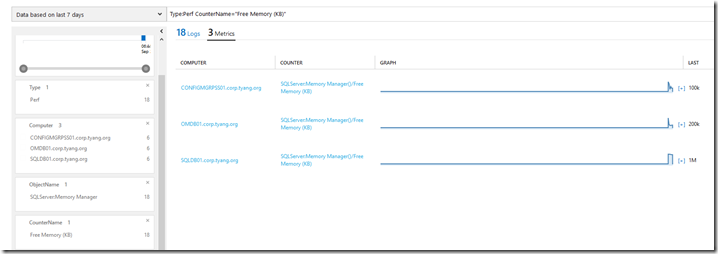
I have created a MP during my experiments today. In the end, I have deleted all the rules that are not working in this MP and kept two sets rules for demonstration purpose:
- Set #1:
- Target: Microsoft.Windows.Computer
- Perf Counter: Processor(_Total)\% Privileged Time
- Set #2:
- Target: Microsoft.Windows.Server.Computer
- Perf Counter: SQLServer:Memory Manager(*)\Free Memory (KB)
You can download my demo MP from the link below:
Disclaimer:
This post is purely based on my own experiment, it may not be 100% accurate. Please use it with caution and test it in your test environment first!
Leave a comment