OpsLogix Capacity Report Management Pack Overview
 Just over a month ago, I have blogged and presented a webcast comparing the OpsLogix Capacity Report Management Pack and the OMS Capacity solution. Since then, an update was released on this management pack and I’d like to take a moment to provide a proper overview for this MP. For those who have not used this management pack and are looking for a solution for capacity forecasting and management, I hope you will have some ideas on the capabilities this management pack provides.
Management Pack Introduction
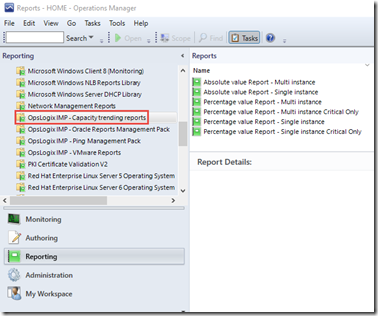
The OpsLogix Capacity Report MP provides OpsMgr reports that can be used to forecast trending of any existing performance data collected by OpsMgr. Same as any other OpsMgr reports, the reports provided by this MP can be accessed from the reporting pane in the OpsMgr console, under “OpsLogix IMP – Capacity trending reports” folder:
Installing and Configuring Management Pack
Other than the capacity report MP itself (OpsLogix.IMP.Capacity_v1.0.2.24.mpb), I was also given a zip file containing my license key. This zip file contains an unsealed MP (OpsLogix.IMP.Capacity.License.xml), which contains my license key and it is unique to my environment. I need to import the license MP into my OpsMgr management group together with the capacity report MP. Once both MPs are imported, you will able to see the reports from the folder shown in the screenshot above.
Reports
This MP offers the following reports:
- Absolute value Report – Single instance
- Absolute value Report – Multi instance
- Percentage value Report – Single Instance
- Percentage value Report – Multi instance
- Percentage value Report – Multi instance Critical Only
- Percentage value Report – Single instance Critical Only
I will now go through these reports.
Absolute value Report – Single instance
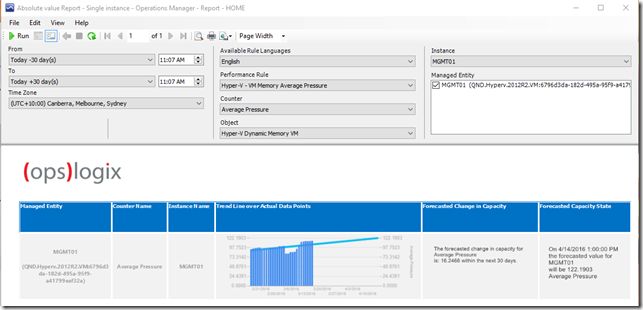
This report allows you to run a forecast report over any performance counters stored in the OpsMgr data warehouse DB. This report requires the following parameters:
- From: The start date for the forecast analysis. The default value is Today – 30 days
- To: the number of forecast days. default value is 30 days from today
- Time zone: choose the time zone of your choice
- Available Rule Languages: The default value is English, when choosing another language, the performance rules that have display strings defined in that particular language (defined in
section in management packs) will appear in the "Performance Rule" drop down list. - Performance Rule: this drop down list contains all the performance rules available for the language that you have chosen.
- Counter: this drop down list contains the counters collected by the performance rule that you have selected. As the best practice, a perf collection rule should only collect one counter, so hopefully you should only see one counter on this drop down list.
- Object: this drop down list contains the object associated to the performance rule and counter
- Instance: this drop down list contains a list of available instances for the performance rule and counter.
- Managed Entity: this drop down list contains a list of managed entities associated to the performance counter instances.
The report looks something like this:
as shown in the screenshot above, the light blue line indicates forecasted future trending for the particular counter that you have chosen. The report also shows the forecasted change and value for the perf counter.
Absolute value Report – Multi instance
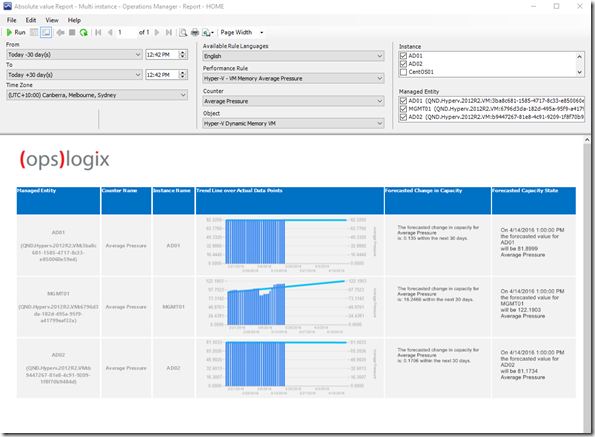
This report is very similar to the “Absolute value Report – Single instance” report. the only difference is, we can choose multiple instances in this report:
As shown in the screenshot above, we are able to choose multiple instances in the “Instance” section (whereas in the single instance report, we can only choose one from the drop down list). The report output displays all instances that you have selected:
Percentage value Report – Single Instance
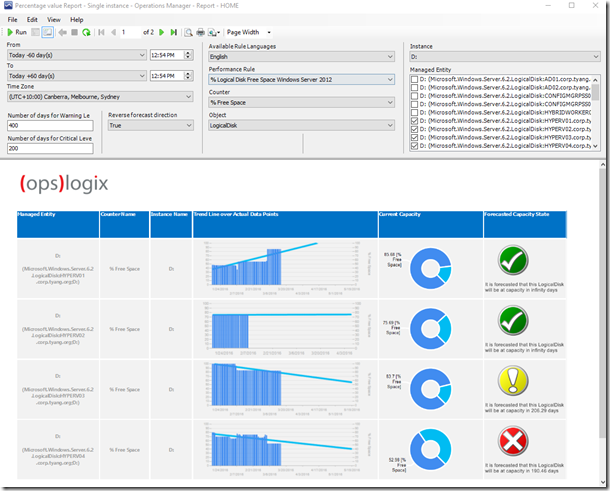
When performance counters are being collected by OpsMgr, some counter values are absolute values (such as logical disk free space in MB). However, some the counter values are percentage based (i.e. % logical disk free space).the percentage value based reports are designed for the percentage based performance counters. Let’s take a look at the “Percentage value Report – Single Instance” report first. This report requires the following parameters:
- From: The start date for the forecast analysis. The default value is Today – 30 days
- To: the number of forecast days. default value is 30 days from today
- Time zone: choose the time zone of your choice
- Number of days for Warning level: choose the warning threshold. – if the forecasted value reaches 100% (or 0% if reverse forecast direction is set to true) within the value specified in this field, the forecasted capacity state will be warning. The default value is 60 days.
- Number of days for Critical level: choose the critical threshold. – if the forecasted value reaches 100% (or 0% if reverse forecast direction is set to true) within the value specified in this field, the forecasted capacity state will be critical. The default value is 30 days.
- Reverse forecast direction: by default, the forecasted capacity state is changed when the forecasted value reaches 100%. But in some cases, we are more interested when the value reaches 0% (i.e. free disk space). In these scenarios, you can specify Reverse forecast direction to “true”.
- Available Rule Languages: The default value is English, when choosing another language, the performance rules that have display strings defined in that particular language (defined in management packs) will appear in the “Performance Rule” drop down list.
- Performance Rule: this drop down list contains all the performance rules available for the language that you have chosen.
- Counter: this drop down list contains the counters collected by the performance rule that you have selected. As the best practice, a perf collection rule should only collect one counter, so hopefully you should only see one counter on this drop down list.
- Object: this drop down list contains the object associated to the performance rule and counter
- Instance: this drop down list contains a list of available instances for the performance rule and counter.
- Managed Entity: this drop down list contains a list of managed entities associated to the performance counter instances.
As you can see from the screenshot above, I have chosen a perf collection rule that collects the % logical disk space for Windows Server 2012. Because this is the single instance report, we are only able to select one instance from the drop down list – in this case, the instance for the perf counter represents the drive letter of Windows Server 2012 logical disks. I have chosen D: drive as the instance, and selected all the D: drives on my Hyper-V hosts from the Managed Entity section.
For the third item on the report indicates according to the forecast, it will run out of space in 206.29 days. Since the warning threshold is configured as 400 days and critical is 200 days. The value 206.29 falls in between the warning and critical threshold, therefore the forecasted capacity state is warning.
For the last item (the 4th) on the report, the forecast indicates it will run out of capacity in 109.46 days, which is less than the configured critical threshold of 200 days, therefore, the forecasted capacity state is critical in this case.
Percentage value Report – Multi Instance
This report is similar to the “Percentage value Report – Single Instance”, but it allows you to select multiple instances for the perf counter you have chosen:
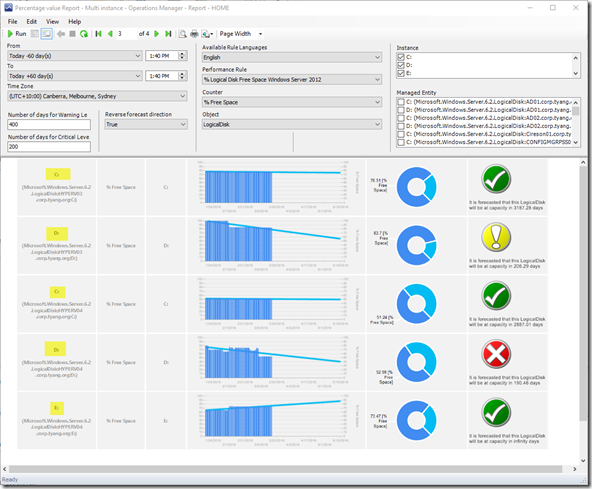
In the example above, I have chosen the “% Logical Disk Free Space Windows Server 2012” perf collection rule, which collects the % Free Space counter for Logical disks on Windows Server 2012 computers. In this case, the instance represents each logical disk’s drive letter (as highlighted). Comparing with the single instance report, we are not only able to choose a specific drive (such as C: drive), but also any other drives (as shown below).
Percentage value Report – Multi / Single instance Critical Only Reports
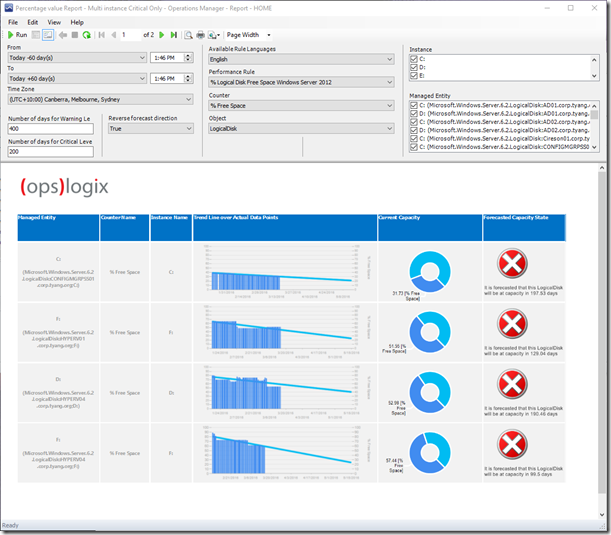
The last two reports from this MP are the “Percentage value Report – Multi instance Critical Only” and “Percentage value Report – Single instance Critical Only” reports. The only differences with these two reports comparing to the previously mentioned percentage value reports is, they filter out any items with healthy and warning forecasted capacity state, and only list the critical items:
So if you don’t really care about the healthy and warning items, and only want to concentrate on critical items, you may find these 2 reports handy.
Summary
The OpsLogix Capacity Report MP provides generic forecasting reports that can be used against any types of performance data collected by OpsMgr. As long as the related perf counters are being collected by OpsMgr, the reports can be used when planning future capacities. The audiences of this MP can be anyone who are using OpsMgr (i.e. server admins, network admins, cloud and fabric admins, DBAs, LOB application owners, etc).
Lastly, if you have any questions, please feel free to contact myself, or OpsLogix sales team directly (sales@opslogix.com).





Leave a comment