An Alternative Solution for OMS Capacity Planning Using Power BI Forecasting Feature
Introduction
Back in September, the Power BI team introduced the Forecasting preview feature in Power BI Desktop. I was really excited to see this highly demanded feature finally been made available. However, it was only a preview feature in Power BI Desktop, it was not available in Power BI online. Few days ago, when the Power BI November update was introduced, this feature has come out of preview and became available also on Power BI Online.
In the cloud and data centre management context, forecasting plays a very important role in capacity planning. Earlier this year, before the OMS Capacity Planning solution V1 has been taken off the shelve, I have written couple of posts comparing OMS Capacity Planning solution and OpsLogix OpsMgr Capacity Report MP, and OpsLogix Capacity Report MP overview. But ever since the OMS Capacity Planning solution was removed, at the moment, we don’t have a capacity planning solution for OMS data sources – the OpsLogix Capacity Report MP is 100% based on OpsMgr.
Power BI Forecasting Feature
When I read the Power BI November update announcement few days ago, I was really excited because the Forecasting feature is finally available on Power BI Online, which means I can use this feature on OMS data sources (such as performance data).
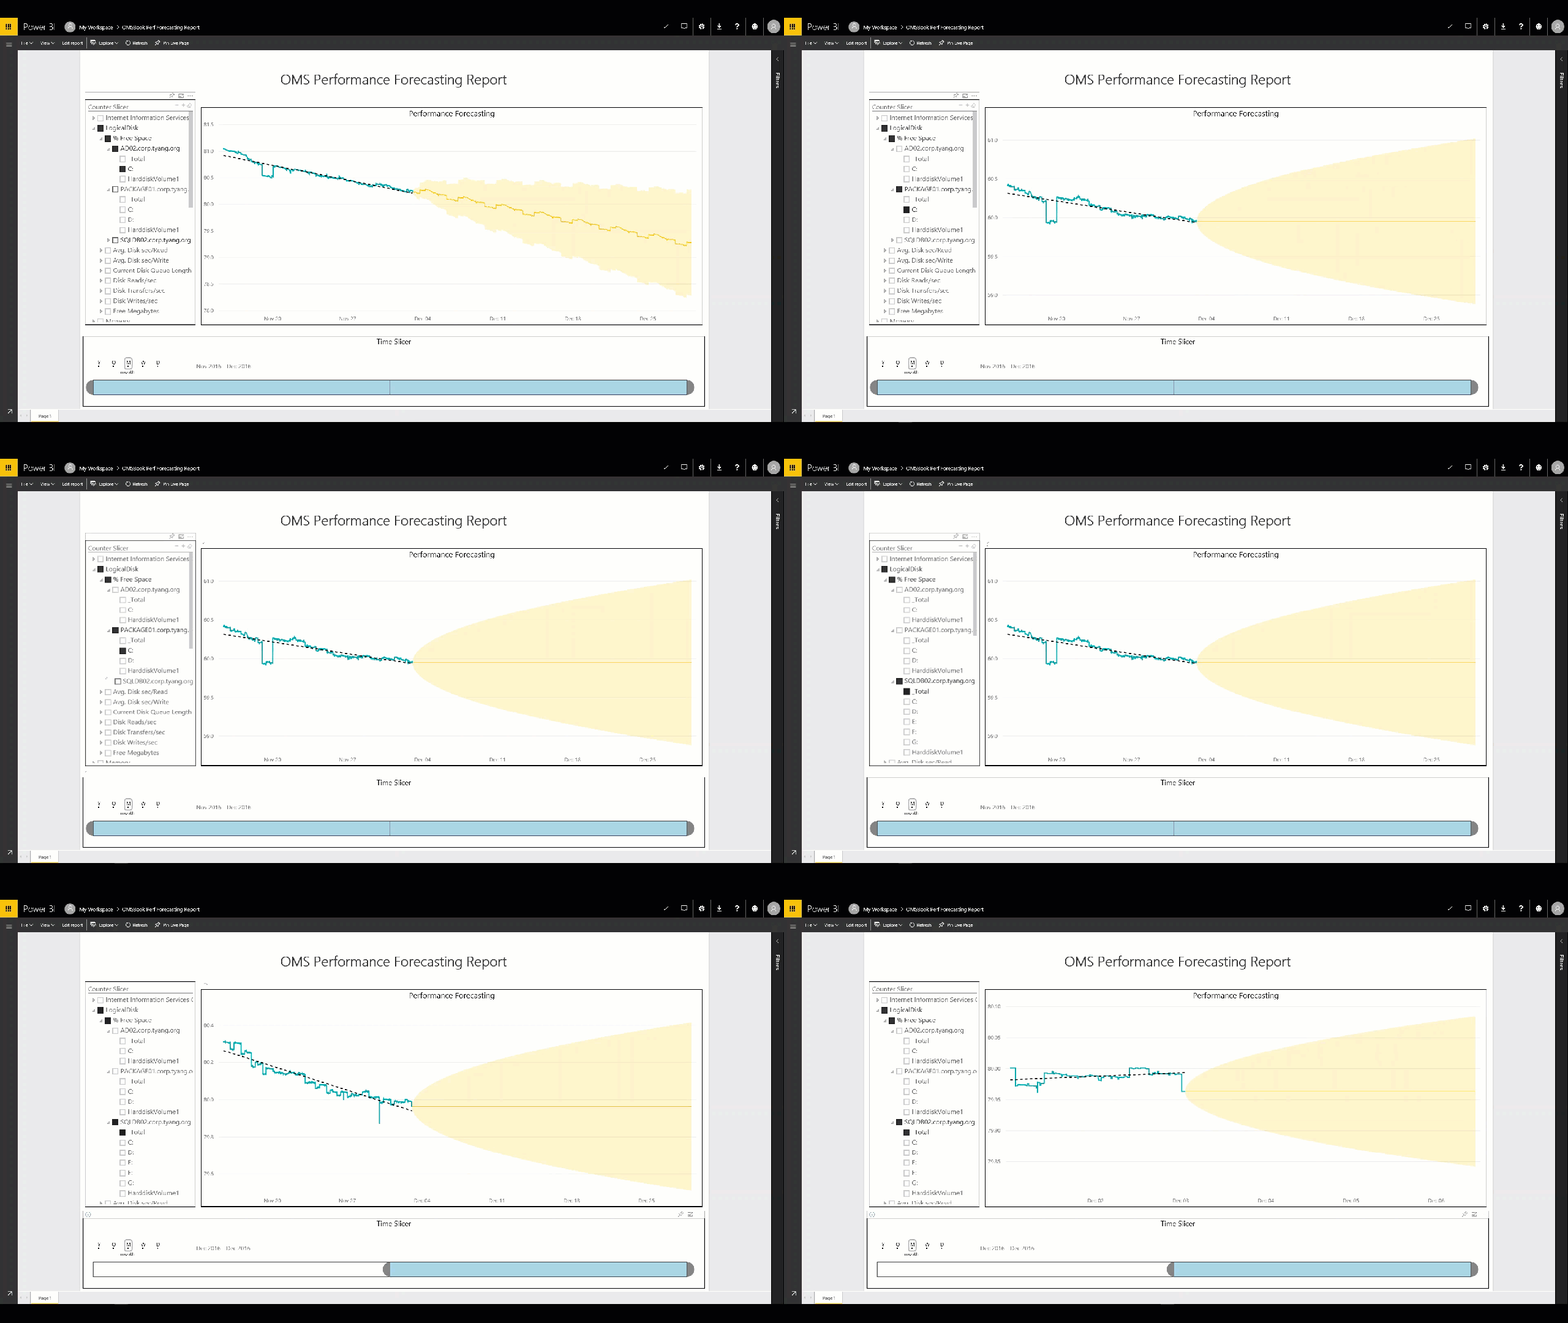
Since I already have configured OMS to pump data to Power BI, it only took me around 15 minutes and I have created an OMS Performance Forecasting report in Power BI:
I’m going to show you how to create this report in the remaining of this post.
Step-by-Step Guide
pre-requisites
-
Make sure you have already configured OMS to inject performance data (Type=Perf) to Power BI.
-
Download required Power BI custom visuals
In this report, I’m using two Power BI custom visuals that are not available out of the box, you will need to download the following from the Power BI Visuals Gallery:
- Hierarchy Slicer (https://app.powerbi.com/visuals/show/HierarchySlicer1458836712039)
- Timeline (https://app.powerbi.com/visuals/show/Timeline1447991079100)
Creating the report
- Click on the data source for OMS perf data, you will see a blank canvas. firstly, import the above mentioned visuals to the report
- Add a text box on the top of the report page for the report title
- Add a Hierarchy Slicer
Configure the slicer to filter on the following fields (in the specific order):
- ObjectName
- CounterName
- Computer
- InstanceName
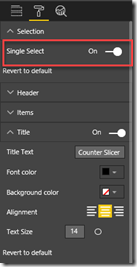
and make sure Single Select on (default value). Optionally, give the visual a title:
- Add a line chart to the centre of the report. Drag TimeGenerated field to Axis and CounterValue to Values. For CounterValues, choose the average value.
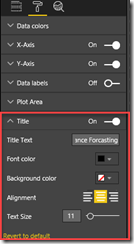
Give the visual a title.
Note: DO NOT configure the “Legend” field for the line chart visual, otherwise the forecasting feature will be disabled.
- In the Analytics pane of the Line Chart visual, configure forecast based on your requirements
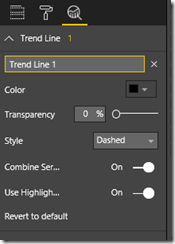
- Optionally, also add a Trend Line
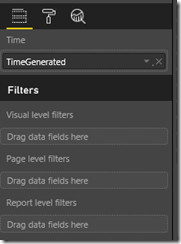
- Add a Timeline visual to the bottom of the report page and drag the TimeGenerated field from the dataset to to the Time field of the visual.
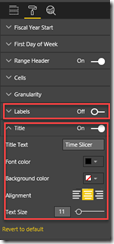
In order to save the screen space, turn of Labels, and give the Timeline visual a title
- Save the report. You can also ping this report page to a dashboard.
Using the Report
Now that the report is created, you can select a counter instance using from the Hierarchy Slicer, and chose a time window that you want the forecasting to be based on from the Timeline slicer. the data on the Line Chart visual will be automatically updated.
Summary
Comparing to the old OMS Capacity Planning Solution, what I demonstrated here only provides forecasting for individual performance counters. It does not analyse performance data in order to provide a high level overview like what the Capacity Planning solution did. However, since there is no forecasting capabilities in OMS at the moment, this provides a quick and easy way to give you some basic forecasting capabilities.




Leave a comment