OpsMgr 2012 Data Warehouse Health Check Script
Note (19/06/2015): This script has been updated to version 1.1. You can find the details of version 1.1 here: https://blog.tyang.org/2015/06/19/opsmgr-2012-data-warehouse-health-check-script-updated/. The download link at the end of this post has been updated too.
I’m sure you all would agree with me that the OpsMgr database performance is a very common issue in many OpsMgr deployments – when it has not been designed and configured properly. The folks at Squared Up certainly feels the pain – when the OpsMgr Data Warehouse database is not performing at the optimal level, it would certainly impact the performance of Squared Up dashboard since Squared Up is heavily relied on the Data Warehouse database.
So Squared Up asked me to build a Health Check tool specific to OpsMgr data warehouse databases, in order to help customers identify and troubleshooting the performance related issues with the data warehouse DB. Over the last few weeks, I have been working on such a script, focusing on the data warehouse component, and produces a HTML report in the end.
We have decided to make this tool not only available to the Squared Up customers, but also to the broader community, free of charge. So on that, BIG Thank-You to Squared Up’s generosity.
Before I dive into the details, I’d like to show you what the report looks like. You can access the sample report generated against my lab MG here:
CLICK HERE TO LAUNCH THE HTML REPORT
As shown in this sample, the report consists of the following sections:
Management Group Information
- Management group name and version
- server names for RMS Emulator, Operational DB SQL Server, Data Warehouse SQL server
- Operational DB name, Data Warehouse DB name
- Number of management servers, Windows agents, Unix agents, managed network devices and agentless managed computers
- Current SDK connection count (total among all management servers)
Data Warehouse SQL Server information
- Server hardware spec and OS version
- SQL server version and collation
- Minimum and Maximum assigned memory to the SQL server
Data Warehouse SQL DB information
- DB Name, creation date, collation, recovery mode
- Current state, is broker enabled, is auto-shrink enabled
- Current DB size (both data and logs), free space %
- Growth settings, last backup date and backup size
Temp DB configuration
- File size, max size and growth settings for each file used by Temp DB
SQL Service Account Configuration
- If the SQL Service account has “Perform volume maintenance tasks” and “Lock Pages in Memory” rights
Data Warehouse Dataset Configuration
- Dataset retention setting
- Retention setting for each dataset
- current row count, size and % of total size of each dataset
- Dataset aggregation backlog
- Staging Table Row Count for the following tables:
- Alert.AlertStage
- Event.EventStage
- Perf.PerformanceStage
- State.StateStage
- ManagedEntityStage
Key SQL and OS performance counters
- SQL performance counters
- SQLServer.Buffer.Manager\Buffer cache hit ratio
- SQLServer.Buffer.Manager\Page.Life.Expectancy
- Operating System performance counters
- Logical Disk(_total)\Avg. disk sec/Read
- Logical Disk(_total)\Avg. disk sec/Write
- Processor Information (_total)\% Processor Time
Collect Data Warehouse performance related events from each management server
- Event ID: 2115
- Event ID: 8000
- Event ID: 31550-21559
Since each environment is different, therefore I didn’t want to create a fix set of rules to flag any of above listed items good or bad. but instead, at the end of each section, I have included some articles that can help you to evaluate your environment and identify if there are any discrepancies.
Prerequisites
This script has the following pre-requisites:
- The user account that is running the script (or the alternative credential passed into the script) must have the following privileges:
- local administrator rights on the Data Warehouse SQL server and all Management servers
- A member of the OpsMgr Administrator role
- SQL sysadmin rights on the Data Warehouse SQL server
- WinRM (PowerShell Remoting) must be enabled on the Data Warehouse SQL Server
- The OpsMgr SDK Assemblies must be available on the computer running the script:
- The script can be executed on a OpsMgr management server, web console server, or a computer that has OpsMgr operations console installed
- OR, manually copy the 3 DLLs from “
\SDK Binary" folder to the folder where the script is located.
Executing the script
The only required parameter is –SDK
i.e.:
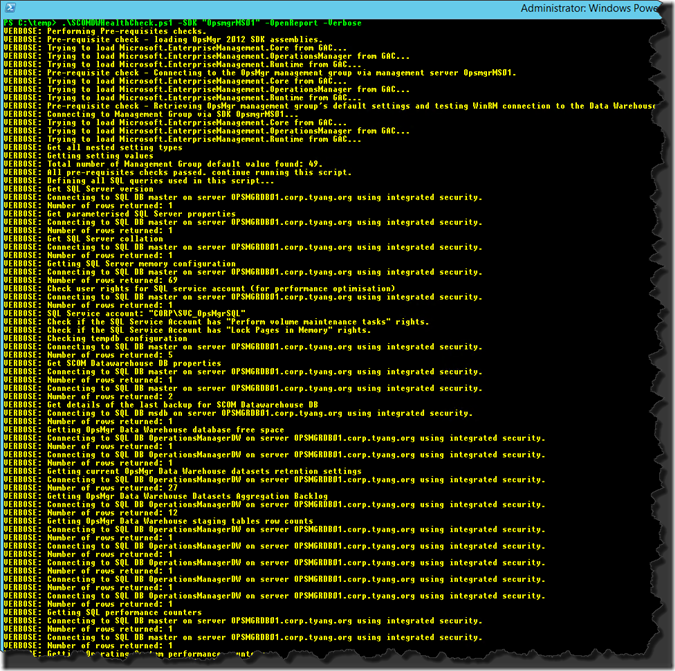
.\SCOMDWHealthCheck.ps1 –SDK "OpsMgrMS01" -OutputDir C:\Temp\Reports\ –OpenReport –Verbose
Or if you need to specify alternative credential:
$password = ConvertTo-SecureString –String "password12345" –AsPlainText –Force
.\SCOMDWHealthCheck.ps1 –SDK "OpsMgrMS01" –Username "domain\SCOM.Admin" –Password $Password –OpenReport –Verbose
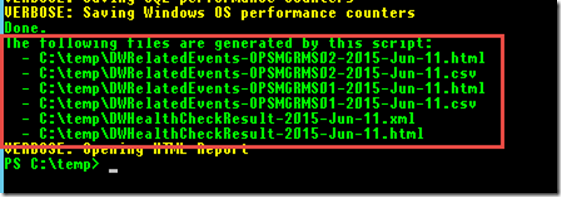
The report outputs the following files:
- Main HTML report
- Main Report in XML format
- Windows Event export from each management server in a separate HTML page
- Windows Event export from each management server in a separate CSV file
Note: The XML file is produced so if anyone wants to develop another set of tool to analyse the data for their own environment, it would be very easy to read the data from the XML file.
The script writes the list of the file it generated as output:
Possible Areas for Improvement
Due to the limited environments that I have access to, I am unable to test this script in environments where Data Warehouse DB is installed on a named SQL instance or a SQL Always-On setup. So if your environment is setup this way, please contact me and let me know what’s working and what’s not. This issue is now fixed in version 1.1 (Updated 19.06/2015)
Credit
I couldn’t have done this by myself. I’d like to thank the following people (in random order) who helped me in testing and provided feedbacks:
Folks from Squared Up: Glen Keech, Richard Benwell
SCCDM MVPs: Marnix Wolf, David Allen, Daniele Grandini, Cameron Fuller, Simon Skinner, Scott Moss, Fleming Riis
And, the legendary Kevin Holman
I’d also like to thank for all the people who has indirectly contributed to this tool (where I included links to their awesome articles and publications in the report). Some of them are already listed above, but here are few more: Paul Keely (Author for the SQL Server Guide for System Center 2012 whitepaper), Michel Kamp, Bob Cornelissen, Stefan Stranger and Oleg Kapustin.
Download
You can download the script from the link below. Please place the 2 files in the zip file in the same directory:
Lastly, as always, please feel free to contact me if you’d like to provide feedback.


Leave a comment