Introduction
This is the 13th instalment of the Automating OpsMgr series. Previously on this series:
- Automating OpsMgr Part 1: Introducing OpsMgrExtended PowerShell / SMA Module
- Automating OpsMgr Part 2: SMA Runbook for Creating ConfigMgr Log Collection Rules
- Automating OpsMgr Part 3: New Management Pack Runbook via SMA and Azure Automation
- Automating OpsMgr Part 4:Creating New Empty Groups
- Automating OpsMgr Part 5: Adding Computers to Computer Groups
- Automating OpsMgr Part 6: Adding Monitoring Objects to Instance Groups
- Automating OpsMgr Part 7: Updated OpsMgrExtended Module
- Automating OpsMgr Part 8: Adding Management Pack References
- Automating OpsMgr Part 9: Updating Group Discoveries
- Automating OpsMgr Part 10: Deleting Groups
- Automating OpsMgr Part 11: Configuring Group Health Rollup
- Automating OpsMgr Part 12: Creating Performance Collection Rules
In the previous post (Part 12), I have demonstrated how to create performance collection rules using the OpsMgrExtended module. In this post, I will demonstrate how to create a 2-State performance monitor.
OpsMgrExtended module provides a function called New-OM2StatePerformanceMonitor. It has been documented in the embedded help within the module. you can access it via the Get-Help cmdlet:
Same as the previous posts, I’m going to show a sample runbook which utilise this function.
Runbook New-2StatePerformanceMonitor
Workflow New-2StatePerformanceMonitor
{
  Param(
    [Parameter(Mandatory=$true)][String]$MonitorName,
    [Parameter(Mandatory=$true)][String]$MonitorDisplayName,
    [Parameter(Mandatory=$true)][String]$CounterName,
    [Parameter(Mandatory=$true)][String]$ObjectName,
    [Parameter(Mandatory=$false)][String]$InstanceName,
    [Parameter(Mandatory=$true)][String]$ClassName,
    [Parameter(Mandatory=$true)][String]$Threshold,
    [Parameter(Mandatory=$true)][String]$UnhealthyState,
    [Parameter(Mandatory=$true)][Boolean]$UnhealthyWhenUnder
  )

  #Get OpsMgrSDK connection object
  $OpsMgrSDKConn = Get-AutomationConnection -Name "OpsMgrSDK_HOME"

  #Hard code which MP to use
  $MPName = "TYANG.SMA.Automation.Perf.Monitor.Demo"

  #Hard code frequency (900 seconds)
  $Frequency = 900

  #Create Performance Monitor, MP Version will be increased by 0.0.0.1
  $MonitorCreated = InlineScript
  {
    #Validate Monitor Name
    If ($USING:MonitorName -notmatch "([a-zA-Z0-9]+\.)+[a-zA-Z0-9]+")
    {
      #Invalid Monitor name entered
      $ErrMsg = "Invalid monitor name specified. Please make sure it only contains alphanumeric charaters and only use '.' to separate words. i.e. 'Your.Company.Windows.Free.Memory.Percentage.Monitor'."
      Write-Error $ErrMsg
    } else {
      #Name is valid, creating the monitor
      New-OM2StatePerformanceMonitor -SDKConnection $USING:OpsMgrSDKConn -MPName $USING:MPName -MonitorName $USING:MonitorName -MonitorDisplayName $USING:MonitorDisplayName -ClassName $USING:ClassName -CounterName $USING:CounterName -ObjectName $USING:ObjectName -InstanceName $USING:InstanceName -Threshold $USING:Threshold -UnhealthyWhenUnder $USING:UnhealthyWhenUnder -Frequency $USING:Frequency -UnhealthyState $USING:UnhealthyState -IncreaseMPVersion $true
    }
  }
  If ($MonitorCreated)
  {
    Write-Output "Monitor `"$MonitorName`" created."
  } else {
    Write-Error "Unable to create monitor `"$Monitorname`"."
  }
}
As you can see, I have hardcoded the following parameters in the runbook:
- Frequency – 900 seconds
- (Unsealed) MP (where the monitor is going to be saved to) - “TYANG.SMA.Automation.Perf.Monitor.Demo”
- Increase MP Version – true
So, before I can kick off this runbook, I need to firstly create the MP. This can be easily done using a one-liner on a machine where OpsMgrExtended is loaded:
New-OMManagementPack -SDK OMMS01 -Name "TYANG.SMA.Automation.Perf.Monitor.Demo" -DisplayName "TYANG SMA Automation Perf Monitor Demo" –Verbose
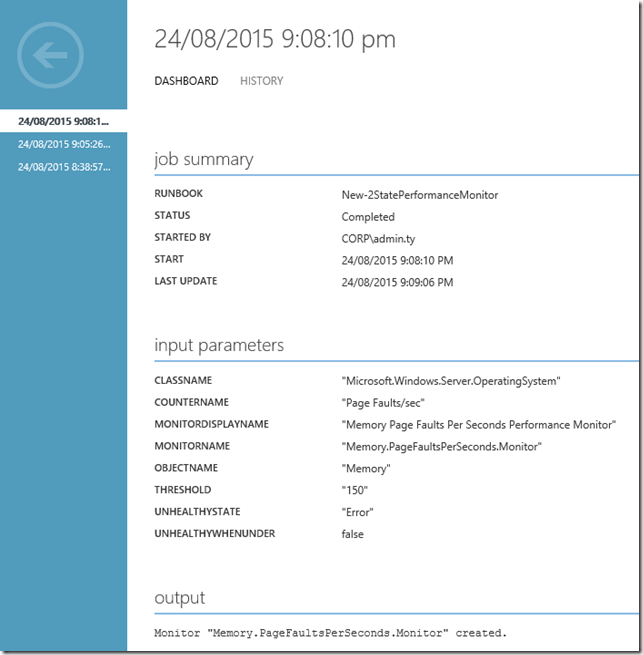
After the test MP is created, I can then execute the runbook. This runbook takes the following input parameters:
- ClassName – The name of the target monitoring class (i.e.Microsoft.Windows.Server.OperatingSystem)
- CounterName – Name of the perf counter
- InstanceName (Optional) –The Name of the instance of the counter. if not specified, the monitor will use All Instances.
- MonitorDisplayName – The Display Name of the monitor.
- MonitorName – The name of the monitor
- ObjectName - Name of the object where the counter belongs to (i.e. memory, logical disk, etc.)
- Threshold – The numeric threshold used by the monitor
- UnhealthState – The unhealthy state of the monitor (Error or Warning)
- UnhealthyWhenUnder (Boolean) – Specify if the monitor is unhealthy when the perf counter is under the threshold (or over the threshold).
Runbook Execution Result:
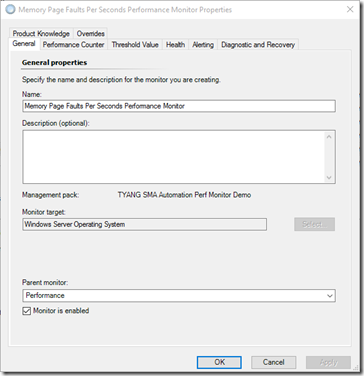
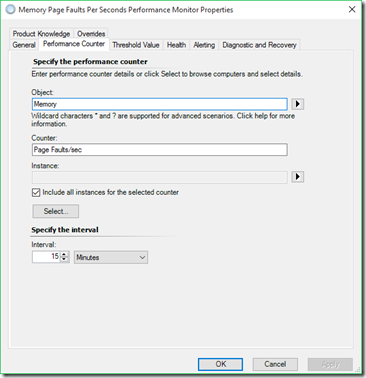
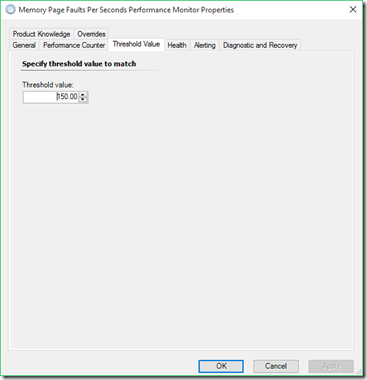
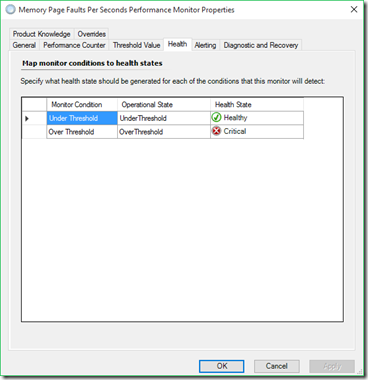
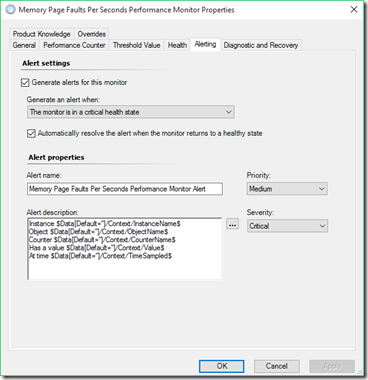
Monitor created by the runbook:
Conclusion
In this post, I have demonstrated a SMA / Azure Automation runbook to create 2-state performance monitors in OpsMgr. Now that I have covered both aspect of the performance data (perf collection rule and monitor), I will move on to the event data in the next post.


Leave a comment